
- Feb 17, 2021
- 96
- 75
- Awards
- 4
- First Name
- Jake

(Auto-specific data can be found towards the end of the article.)
When we launched the newsletter back in February the first issue was “7 Review Benchmarks for 2021”. Find the 2020 benchmarks here.
This week I’d like to revisit the topic and explore how our data has changed in the first half of 2021.
Before we get into it, as a caveat, the data pulled reflects the Widewail database, 1,400+ local businesses that are committed to generating reviews and responding.
While not an accurate picture of local business more broadly, within our world, these are the benchmarks and how they have changed in the first half of ‘21.
Average monthly reviews per location increase to 50
2021: 50
2020: 29
Across the board, activity is up. This is great for search rank. Remember, two core rank indicators (related to reviews) for Google are review volume and frequency.
From my POV an average monthly review volume of 50 is very good. Most local businesses will struggle to compete with that.
Greater adoption of Invite, making it easy for customers to submit reviews via their phone is driving more review activity.
Negative sentiment continues to decrease
2021: 9%
2020: 12.1%
2019: 13.4%
I’m amazed this number continues to get smaller. Now, 91% of reviews are positive.
Tactically, the combination of making it easy for happy customers to leave feedback and prompt and professional review response to all reviews continues to push this number down.
I’ve said this before but it’s always worth repeating: with the right approach, negative reviews will be less frequent and manageable. Proactively asking your customers does not generate more negative feedback. Contrary, ratings tend to go up and negative review percentage down.
Average star rating sees slight uptick
2021: 4.6
2020: 4.5
In line with the negative sentiment percentage, the average star rating creeps slightly higher in the first half of 2021.
We find that 4.5-4.8 is the sweet spot combo of high ratings while still maintaining authenticity and credibility.
Average ratings by review site
2021:
Facebook: 4.7 (+0.3)
Google: 4.7 (+0.1)
Yelp: 3.4 (+0.1)
2020:
Google - 4.6
Facebook - 4.4
Yelp - 3.3
Winner: Facebook
Loser: Yelp
Same as last year, Yelp consistently underperforms. If you’re on Yelp be sure to adjust your perception of what’s “good” accordingly.
Average rating for COVID-related reviews
2021: 4.2
2020: 4.1
A slight uptick here, nothing much to comment on but performance in the face of unique pandemic challenges continues to be stellar.
AUTOMOTIVE-SPECIFIC DATA:
Average rating by review site
2021:
DealerRater: 4.7 (+0.0)
Cars.com: 4.6 (+0.1)
CarFax: 4.6 (+0.0)
CarGurus: 4.1 (-0.1)
2020:
DealerRater - 4.7
CarFax - 4.6
Cars.com - 4.5
CarGurus - 4.2
Automotive-specific rating sites have stayed consistent for the last 6 months.
Automotive department ratings
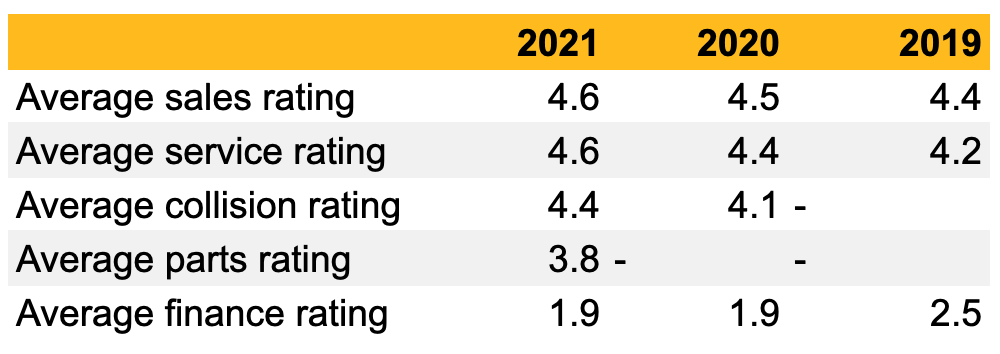
The positive trend continues for sales and service ratings as we get deeper into 2021.
As a side note, while the collision, parts, and finance ratings are generally low, the comparative share of review volume in those categories is very low.
Thanks for reading. If you enjoyed this, maybe I can tempt you with my local marketing newsletter.
Bite-sized, to-the-point, trend-driven local marketing stories and tactics delivered 2x/month.
See you in 2 weeks - Jake, Marketing @Widewail
Last edited: