I've been with DealerOn for nearly 2 years. I really like the websites and for all the complaining you hear about vendor support, DealerOn is by far the best vendor I work with. Absolutely top notch service.

You are using an out of date browser. It may not display this or other websites correctly.
You should upgrade or use an alternative browser.
You should upgrade or use an alternative browser.
Attention website vendors
- Thread starter Jake L
- Start date

Wow, that was not my experience. We went from Autofusion to Dealer.com and saw an immediate improvement. No matter what I looked at, bounce rate, conversions, traffic, time on site ...everything improved. The Dealer.com backend tool sucks but I liked the website.
Just gonna say make sure youre using Google Analytics to track those, and not so much what the vendor says. They only have room to gain by inflating stats...not saying that's the case, but ya never know.
- Oct 23, 2011
- 262
- 118
- Awards
- 5
- First Name
- Kelly
Just gonna say make sure youre using Google Analytics to track those, and not so much what the vendor says. They only have room to gain by inflating stats...not saying that's the case, but ya never know.
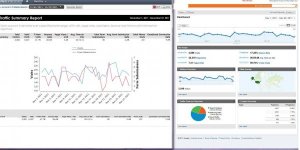
You mean there's a difference between these numbers....REALLY?

But as the activity bar will tell you, Dealer.com accesses google analytics in their reporting tool...hmmm
Facts are only as good as the cross-referencing backing them up.
Attachments
Last edited:

- Dec 2, 2009
- 1,047
- 720
- Awards
- 9
- First Name
- John
You mean there's a difference between these numbers....REALLY?
View attachment 696
But as the activity bar will tell you, Dealer.com accesses google analytics in their reporting tool...hmmm
Facts are only as good as the cross-referencing backing them up.
Sorry... my eyes started going earlier this year... are the numbers similar?
")
- Oct 23, 2011
- 262
- 118
- Awards
- 5
- First Name
- Kelly
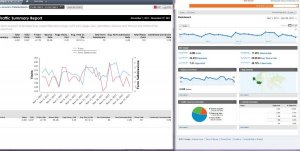
Sorry... my eyes started going earlier this year... are the numbers similar?
Only if you consider avg time on site varying by ~50% similar...at least the Bounce rate looks better
")
I'm a girl of high expectations...and as the first dedicated "Internet Manager" here...some vendors are on board this boat, some are paddling to catch up, and some need a bucket...
I can't wait to have the power to bring on new hands and take others to the plank!

- Dec 2, 2009
- 1,047
- 720
- Awards
- 9
- First Name
- John
Only if you consider avg time on site varying by ~50% similar...at least the Bounce rate looks better
I'm a girl of high expectations...and as the first dedicated "Internet Manager" here...some vendors are on board this boat, some are paddling to catch up, and some need a bucket...
I can't wait to have the power to bring on new hands and take others to the plank!
Ahhhh...... bouncing off the plank into the bucket... gotcha! (Happy Hour start early?? haha
 )
)I can understand Bounce Rate differences, however, as the formula for a "bouce" is like a snowflake: I've never seen the same two alike.

- May 1, 2006
- 3,636
- 2,582
- Awards
- 13
- First Name
- Alex
I can understand Bounce Rate differences, however, as the formula for a "bouce" is like a snowflake: I've never seen the same two alike.
The big differences on bounce rate measurements are:
Calculations based on time (<10 seconds, <20 seconds, etc)
Calculations based on per page view
Calculations based on per session
There isn't a standard and some analytics use a combination of variables.
- Apr 29, 2011
- 474
- 242
- Awards
- 7
- First Name
- Chris
One often misunderstood fact about Google Analytics is that their data is not entirely accurate, for several reasons.
1. It's a third party system -- users with privacy controls in their browser or networks that restrict traffic won't allow communication with GA servers.
2. It's a distributed system -- the reason Google Analytics is ~6hrs behind is because each server (it's a widely distributed system) needs to synchronize records to your account. The numbers you see don't paint the whole story, but within an acceptable margin of error.
Did some Google'ing and came across this comment from a blog post that I thought was worth a look:
I developed real-user performance (like Google Analytics) and behavior (similar to ClickTracks, etc) monitors for six years, and have worked with enterprise ecommerce and financial sites. I wrote an article that includes a comparison between the different collection methods: Web Page Passive Monitoring
Passive monitors like Google Analytics mostly are intended to track real visitors vs. actual server requests. Stats derived from web logs are great for SLA validation and to identify actual server load, but may not be entirely representative of actual visitors.
There is a noticeable gap between the passive monitors and log analyzers. For example, if a browser displays a cached page, but doesn't send a 302 request (ie: sometimes when using the back button), no request would be made for the log analyzer to report. This is one place where the passive monitors shine - picking up the cached requests.
Any passive monitor worth its salt will include a <noscript /> element to compensate for having script disabled. However, if third-party image loading is disabled (image requests being the most common way of communicating data post page load), or javascript is disabled and the client doesn't parse or interpret noscript elements, then the passive monitor will miss that user agent entirely.
There are a lot of metrics that can be derived from passive monitors that are simply beyond the view of log shredders and server-side monitors. These include accurate render time, script errors, content assertions, client latency (how long did it take from the user's point of view, not just the server point of view), third-party content load times (ie: if you have a CDN, and get approximate load times for some of their content as observed by the end user). On top of that, you can include behavior monitoring (eg: Identifying Behavior by Content Type ).
As mentioned, passive monitors don't tell the whole story. There are the myriad bots crawling a web site, automated browsers designed to test and or attempt hacks against a site, and users like myself who block known third party passive monitors (analytics, coremetrics, etc).
In summary, I think Google Analytics provides a decent approximation of real user traffic. However, I don't think one type of solution solution, passive monitoring or log shredding, reveals the whole story.
- Apr 29, 2011
- 474
- 242
- Awards
- 7
- First Name
- Chris
One often misunderstood fact about Google Analytics is that their data is not entirely accurate, for several reasons.<br><br>1. It's a third party system -- users with privacy controls in their browser or networks that restrict traffic won't allow communication with GA servers.<br>2. It's a distributed system -- the reason Google Analytics is ~6hrs behind is because each server (it's a widely distributed system) needs to synchronize records to your account. The numbers you see don't paint the whole story, but within an acceptable margin of error. <br><br>Did some Google'ing and came across this comment from a blog post that I thought was worth a look:<br><br>
Some website vendors may include their own stats (like a print page increment-er) and stats from their own server logs (AWStats) that I'm sure will vary stat package to stat package. Stat tracking for items like printed vehicle brochures, send-to-mobile, etc are in most cases click counters and don't filter out dupes or track sessions. Best way to measure those is through conversion codes, IMO.
<div class="discussBody">
I developed real-user performance (like Google Analytics) and
behavior (similar to ClickTracks, etc) monitors for six years, and have
worked with enterprise ecommerce and financial sites. I wrote an
article that includes a comparison between the different collection
methods: <a rel="nofollow" href="http://www.whitefrost.com/documents/html/technical/dhtml/monitor.html">http://www.whitefrost.com/documents/html/technical/dhtml/monitor.html</a><br><br>Passive
monitors like Google Analytics mostly are intended to track real
visitors vs. actual server requests. Stats derived from web logs are
great for SLA validation and to identify actual server load, but may not
be entirely representative of actual visitors.<br><br>There is a
noticeable gap between the passive monitors and log analyzers. For
example, if a browser displays a cached page, but doesn't send a 302
request (ie: sometimes when using the back button), no request would be
made for the log analyzer to report. This is one place where the
passive monitors shine - picking up the cached requests.<br><br>Any
passive monitor worth its salt will include a <noscript /> element
to compensate for having script disabled. However, if third-party
image loading is disabled (image requests being the most common way of
communicating data post page load), or javascript is disabled and the
client doesn't parse or interpret noscript elements, then the passive
monitor will miss that user agent entirely.<br><br>There are a lot of
metrics that can be derived from passive monitors that are simply beyond
the view of log shredders and server-side monitors. These include
accurate render time, script errors, content assertions, client latency
(how long did it take from the user's point of view, not just the server
point of view), third-party content load times (ie: if you have a CDN,
and get approximate load times for some of their content as observed by
the end user). On top of that, you can include behavior monitoring (eg:
<a rel="nofollow" href="http://www.whitefrost.com/Blog/steve/Identifying Behavior by Content Type">Identifying Behavior by Content Type</a> ).<br><br>As
mentioned, passive monitors don't tell the whole story. There are the
myriad bots crawling a web site, automated browsers designed to test and
or attempt hacks against a site, and users like myself who block known
third party passive monitors (analytics, coremetrics, etc).<br><br>In
summary, I think Google Analytics provides a decent approximation of
real user traffic. However, I don't think one type of solution
solution, passive monitoring or log shredding, reveals the whole story.
</div>
Some website vendors may include their own stats (like a print page increment-er) and stats from their own server logs (AWStats) that I'm sure will vary stat package to stat package. Stat tracking for items like printed vehicle brochures, send-to-mobile, etc are in most cases click counters and don't filter out dupes or track sessions. Best way to measure those is through conversion codes, IMO.
I did look a Google Analytics. Like Kelly, there wasn't a significant difference between Google and Dealer.com's stats. When we made the change, all of our numbers improved including lead count. My ex-wife was also "a girl of high expectations"!?!