Hello,
This is my first post and I'm sure it won't be my last. I just found this forum and I can't believe I haven't stumbled upon it sooner.
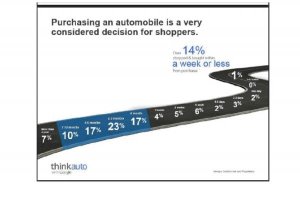
I'm currently putting together a presentation on the importance of long term follow-up for BDC (Internet/Phone) leads. I'm looking for a chart or graph or timeline that shows when customers buy. For example, 20% of internet leads buy within 30 days...70% buy within 120 days, etc. I really need some type of graphic representation of this. I've searched ALL over the internet (how I found this site) and I can't find anything like this anywhere.
I would GREATLY appreciate any help!
Thanks,
Rob
This is my first post and I'm sure it won't be my last. I just found this forum and I can't believe I haven't stumbled upon it sooner.
I'm currently putting together a presentation on the importance of long term follow-up for BDC (Internet/Phone) leads. I'm looking for a chart or graph or timeline that shows when customers buy. For example, 20% of internet leads buy within 30 days...70% buy within 120 days, etc. I really need some type of graphic representation of this. I've searched ALL over the internet (how I found this site) and I can't find anything like this anywhere.
I would GREATLY appreciate any help!
Thanks,
Rob