- Dec 19, 2018
- 653
- 616
- Awards
- 8
- First Name
- Bill
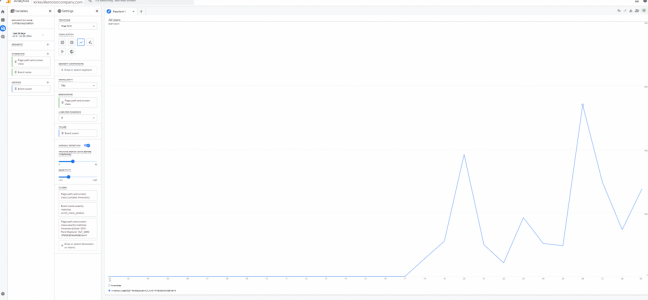
I'm still struggling a bit to adapt to GA4. It just seems to me that some of the things that were simple in UA are much more complicated than they are in GA4. For instance, I'm trying to track a specific event name on a line chart showing how many times a specific event fired on a specific vehicle. To do this, I created an Exploration using the page path and screen class dimension combined with the event name dimension and included the event count metric. Then, I used filters to narrow down the pages and a specific name. Then I right-click on a particular page path and "Include only selection" and then click to the line chart visualization. This seems so much more complicated than it has to be.