


• This thread is just the tip of the iceberg.The people ahead of the curve aren't Googling for answers — they're already in here, having the conversations you haven't found yet. DealerRefresh is free.Get the full picture →

Core Web Vitals Rankings - I spent way too much time on this to rank 1300 websites

dealerdata1

Full Sticker + Prep
Jul 15, 2026
22
14
Awards
3
First Name
Jake
I'll be nice and give the TLDR version at the top here so here it goes

Built a tool that runs the Google Lighthouse API every day, got a lot of data over two years, now making the data available to everyone

Dealership Website Performance Monitor | Dealer Data One

Ok story time and background on this all

A couple years ago now there was a collective question about core web vitals and how it impacts website performance for a user engagement viewpoint. So I built an overly complex tool that would run every single website (~1200) every day at random times of the day to truly measure the CWV metrics. It was an internal tool this whole time, but I made a quick and easy front end tool that simply called the lighthouse API

Did a couple case studies off of it, and no surprise CWV does impact overall site performance and user engagement and all of that, plenty of other vendors have published studies on that

BUT I was thinking the other day...we need an industry level report card. Information and data is so gate kept in some areas it was starting to rub me the wrong way and instead of gate keeping this information I wanted to make it public

So when you run your site in this tool it adds it to our list, spits out your immediate CWV scores, gives a little AI summary with CWV distro data, and then tracks and ranks it by OEM, Website Vendor, and eventually State/Region

If you have ever worked on the lighthouse API before or even tried running your own site through googles tool, you know that sometimes it can be a little slow, or occasionally wont return scores due to the API hanging OR because there isnt enough data on your site. So if you are sitting there going, man this is taking a while.... you are correct, but do not worry as that is the intended functionality

My end goal is to have a comprehensive industry report for every manufacturer and website vendor that shows overall performance and give a bit of a rankings list on who has the best performing dealership site in the Country depending on how we want to segment that.

There are still some manufacturers or website vendors that havent made it into the rankings so if you run your site and dont see any rankings data, do not fear, you are just the first of your kind

Anyway that is all, if you have feedback I am always open!

Couple other tools I have in the cooker that you can kinda play with now:
SEO and AI visibility tracker and ranker
Email and Domain Security Checker

Always free, not gonna ask you for anything. Maybe I need one of those links to buy me a coffee or something, or Celsius, the fridge is getting low on that and beer
 
This is great work and I'd add one column to the report card that Lighthouse can't see: the no-JS word count. Fetch each homepage and a VDP without executing JavaScript and count the words that come back. GPTBot, ClaudeBot and most of the AI answer engines don't run JS, so that number is literally what they read.

We did this for our own category last week. Three vendor sites in our space returned under ten words to a plain fetch. Full marketing site, zero words for a crawler. And I'll own ours: our homepage was a React app shipping 317 crawlable words until we fixed it. Perfect CWV, invisible to half the crawlers that matter now.

The reason it belongs next to CWV is that the correlation runs the wrong way. The fastest dealer sites tend to be the most client-rendered ones, so the green Lighthouse score and the empty crawler view show up together more often than you'd think. If your tool already fetches 1,300 sites a day you're one flag away from the first industry number on it. Happy to share the fetch we used.
 
This is great work and I'd add one column to the report card that Lighthouse can't see: the no-JS word count. Fetch each homepage and a VDP without executing JavaScript and count the words that come back. GPTBot, ClaudeBot and most of the AI answer engines don't run JS, so that number is literally what they read.

We did this for our own category last week. Three vendor sites in our space returned under ten words to a plain fetch. Full marketing site, zero words for a crawler. And I'll own ours: our homepage was a React app shipping 317 crawlable words until we fixed it. Perfect CWV, invisible to half the crawlers that matter now.

The reason it belongs next to CWV is that the correlation runs the wrong way. The fastest dealer sites tend to be the most client-rendered ones, so the green Lighthouse score and the empty crawler view show up together more often than you'd think. If your tool already fetches 1,300 sites a day you're one flag away from the first industry number on it. Happy to share the fetch we used.
Funny you mention it but the tool does actually fetch this data, we just don't expose it yet.

It will certainly be part of a larger case study once I can get more dealers in this and a wider variety of website vendors. But some website vendors really like blocking bot crawls.

I foresee a secondary CWV-esque data set living besides Mobile and Desktop CWV metrics that will be AI/Crawl focused metrics.

Hoping we can get the industry wide report out by year end on this, but all in due time
 
That is the right call, and the vendor blocking is the part worth surfacing on its own. A site that returns 403 to a plain fetch is returning 403 to GPTBot and ClaudeBot too, so from the AI side it does not matter whether the vendor calls it bot protection or an accident, the dealer is invisible either way. If you split the no-JS word count by website vendor when you publish, that one table will do more for dealers than another CWV leaderboard, because it names the fix and who has to make it. If it helps line the numbers up, our check was nothing fancy: plain GET, no cookies, count words in the body text, run it on the homepage and one VDP per rooftop. Glad to compare notes when the report is closer.
 
Joe, this is the part I think dealers really need to see in plain English.

From the dealer side, I don’t care whether somebody calls it bot protection, a rendering decision or an accident. If I’m paying for a website that looks fine in a browser but the vehicle and dealership content isn’t actually readable by the systems people are increasingly using to research, that’s a problem — especially if the dealer has no idea it’s happening.

I’d actually like to see the report separate a few things: what comes back in a plain no-JS fetch, whether the major crawlers are specifically allowed or blocked, and whether the important content on the homepage and VDP is available without relying on JavaScript.

One thing I would be careful about is assuming a generic 403 automatically means every named crawler gets the exact same response. Vendors can treat user agents and traffic differently, so I’d rather test that directly and let the data say who can actually read what.

But I completely agree on breaking it out by website vendor. That’s where this becomes useful for a dealer. Don’t just tell me my score is bad; show me whether it’s my store, my website setup or something the vendor needs to fix.

If Jake can get enough rooftops behind it to make the comparison fair, that becomes a report I’d absolutely use in a vendor conversation. I’d be happy to help pressure-test it from the dealer side when you guys get closer.
 
Joe, this is the part I think dealers really need to see in plain English.

From the dealer side, I don’t care whether somebody calls it bot protection, a rendering decision or an accident. If I’m paying for a website that looks fine in a browser but the vehicle and dealership content isn’t actually readable by the systems people are increasingly using to research, that’s a problem — especially if the dealer has no idea it’s happening.

I’d actually like to see the report separate a few things: what comes back in a plain no-JS fetch, whether the major crawlers are specifically allowed or blocked, and whether the important content on the homepage and VDP is available without relying on JavaScript.

One thing I would be careful about is assuming a generic 403 automatically means every named crawler gets the exact same response. Vendors can treat user agents and traffic differently, so I’d rather test that directly and let the data say who can actually read what.

But I completely agree on breaking it out by website vendor. That’s where this becomes useful for a dealer. Don’t just tell me my score is bad; show me whether it’s my store, my website setup or something the vendor needs to fix.

If Jake can get enough rooftops behind it to make the comparison fair, that becomes a report I’d absolutely use in a vendor conversation. I’d be happy to help pressure-test it from the dealer side when you guys get closer.

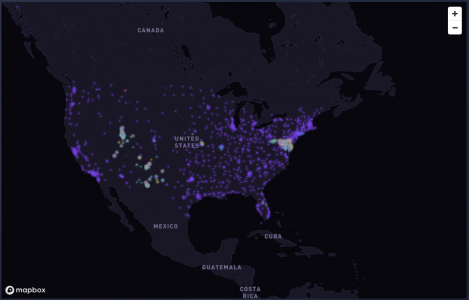
Map is outdated, but I am up to nearly 2100 franchised rooftops now. Showing 1,992 below.

I pull a few hundred new rooftops everyday to keep it under API budget quotas.

We are getting there!

1788887551583.png
 
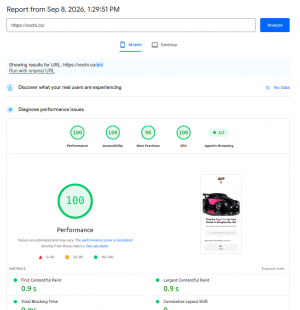
I wonder why my actual September 8 Lighthouse result is a lot better than the what your tool suggests?

My current Lighthouse result says​

For example.com - Experts in Django Development:

MetricYour resultAssessment
Performance100Excellent
FCP0.9 sExcellent
LCP0.9 sExcellent
TBT0 msExcellent
CLS0Perfect
Speed Index0.9 sExcellent
Accessibility100Excellent
Best Practices96Very good
SEO100Excellent

Is "Discover what your real users are experiencing No Data" causing the score to drop?

That does not mean Vochi has bad Core Web Vitals.

It means Google doesn't currently have enough Chrome User Experience Report (CrUX) data for that URL/origin to provide the field-data report.

So why did your tool say 81/100?​

"The lab test estimates a Core Web Vitals score of 81/100 on desktop..."
That is inconsistent with the Lighthouse report I’m seeing?
1788892849504.png
 
I wonder why my actual September 8 Lighthouse result is a lot better than the what your tool suggests?

My current Lighthouse result says​

For example.com - Experts in Django Development:

MetricYour resultAssessment
Performance100Excellent
FCP0.9 sExcellent
LCP0.9 sExcellent
TBT0 msExcellent
CLS0Perfect
Speed Index0.9 sExcellent
Accessibility100Excellent
Best Practices96Very good
SEO100Excellent

Is "Discover what your real users are experiencing No Data" causing the score to drop?

That does not mean Vochi has bad Core Web Vitals.

It means Google doesn't currently have enough Chrome User Experience Report (CrUX) data for that URL/origin to provide the field-data report.

So why did your tool say 81/100?​

"The lab test estimates a Core Web Vitals score of 81/100 on desktop..."
That is inconsistent with the Lighthouse report I’m seeing?
View attachment 11607


Good question, and there's a few things happening here. One of them being I forgot to upload the updated front end site tool lmao got distracted with pulling data in for a few thousand-ish dealers to feed this tool.

Lab scores are fine but they're never a real indicator of real world performance, since the real world is unpredictable. At the same time, if there isn't enough live user data Google can't reliably generate the field metrics that make up the CWV scores, which is what you're seeing with the No Data on your report.

We also don't use the overview scores Google provides unless as an absolute fallback. Ours are weighted on the CWV metrics directly.

This comes up on plenty of dealer websites too, so the question becomes how do you handle a site that doesn't have enough traffic to generate reliable data. The answer is simply that we keep monitoring until it does. Same applies to a newly launched website, think dealer buy/sells. We wouldn't have CWV data for at minimum 28 days, or whatever Google determines the reporting period is. But nobody else will either, since it's purely driven off traffic to the site, and like anything else you have to have enough data to measure.

So what's the point of lab data? Troubleshooting.

Even if CWV data is good, or mediocre, we can identify areas of opportunity to improve. Lab runs on a throttled mid tier device with a simulated slow connection, so it's built to be pessimistic on purpose. Your LCP could be 4 seconds in lab and 2.4 in the field. That's not a contradiction, that's real users on better hardware and better connections than the test. Field tells you where users are today. Lab tells you what breaks first when conditions get worse.


There's another piece to this that doesn't get talked about enough, which is the technology your actual market is running on.

The federal push to get fiber everywhere got reworked into a technology neutral approach, which in practice means a lot of rural areas are getting satellite or fixed wireless instead. So if you're a store in a rural market, a meaningful chunk of your shoppers are on connections with high latency and inconsistent throughput, not the fiber connection the guy in the metro store's market has.

That's why the same site can perform completely differently depending on who's actually visiting it. A heavy site in a metro market gets carried by good infrastructure. That same site in a rural market punishes every shopper who loads it. Field data will show you that split if you have enough traffic to generate it, but lab is the thing that tells you how much weight you're asking people to carry in the first place.

Know what your market is actually running on and build for that, not for the connection you have at your desk.


TLDR: with lab scores like that I'd expect you to have excellent Core Web Vitals once you've got enough traffic for Google to report them, though that also depends on what your actual market is running on. Fiber and 5G in a metro market will carry a site that a rural satellite connection won't.

On the variance in the overall score, our run and the PSI run you're looking at aren't the same test. Different throttling config, different machine, different moment. Lab numbers move run to run, less than they used to but it's still there, and two separate runs minutes apart can land differently. That's part of why we run daily and look at the trend rather than treating any single run as truth.
 

✨ AI Highlights

A developer shares a free tool built on two years of daily Google Lighthouse API data tracking Core Web Vitals for roughly 1,200 dealership websites. The thread quickly evolves into a deeper discussion about a critical blind spot: many fast-loading dealer sites are built with client-side rendering that returns little or no content to crawlers that don't execute JavaScript — including AI bots like GPTBot and ClaudeBot. The key insight is that perfect CWV scores can coexist with near-total invisibility to AI answer engines, and the community pushes for the tool to also report no-JS word counts and crawler blocking status by vendor.

Replies Views 7 1,363 Started Last Reply