• Stop being a LURKER - join our dealer community and get involved. Sign up and start a conversation.

If AutoTrader traffic goes down, why doesn't the bill?

jssimonton

Sled Master
Mar 9, 2011
39
16
First Name
Jeff
I ran across an article about Quantcast.com which "quantifies" website traffic. After looking at a few websites, I took a shot at AutoTrader and the results were quite interesting. Now, I'm not one to trust some website's "estimate" of traffic... that would be naive... so I graphed the "Audience" numbers from my AutoTrader reports for 2011 against the Quantcast stats and they really do correlate:
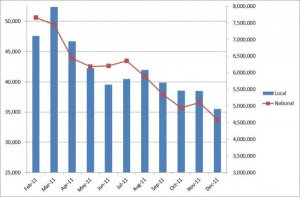
Autotrader-Quantcast-Vs-Local-11Months.jpg

To the assembled internet marketing wisdom here I present this information in hopes of learning a few things:
1) Is this true in your market as well and has it come with a corresponding drop in leads?
2) If Quantcast is accurate, Cars.com has also dropped (not as much) over the same year, so where are people going to search for cars?
3) It would appear that the ROI from AT and Cars.com are dropping... shouldn't our bills?

In addition, I want to point out that the actual stats I'm using from my market (Flint/Saginaw, MI) were part of our monthly back-end reporting in 2011, but do not show in January 2012. Perhaps they realized that someone would point out their loss of traffic?
 
I ran across an article about Quantcast.com which "quantifies" website traffic. After looking at a few websites, I took a shot at AutoTrader and the results were quite interesting. Now, I'm not one to trust some website's "estimate" of traffic... that would be naive... so I graphed the "Audience" numbers from my AutoTrader reports for 2011 against the Quantcast stats and they really do correlate:

View attachment 887

To the assembled internet marketing wisdom here I present this information in hopes of learning a few things:
1) Is this true in your market as well and has it come with a corresponding drop in leads?
2) If Quantcast is accurate, Cars.com has also dropped (not as much) over the same year, so where are people going to search for cars?
3) It would appear that the ROI from AT and Cars.com are dropping... shouldn't our bills?

In addition, I want to point out that the actual stats I'm using from my market (Flint/Saginaw, MI) were part of our monthly back-end reporting in 2011, but do not show in January 2012. Perhaps they realized that someone would point out their loss of traffic?

Jeff,

In my records, I show a significant seasonality cycle where winter internet shopping starts up right after the Christmas/New Years holiday. I find that Internet shopping gets soft(er) when the weather breaks and warmth returns.

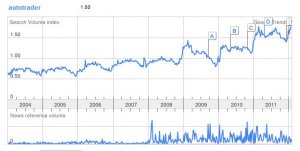
If you look closely at google trends chart for the term "AutoTrader" below, you'll see
#1: Strong seasonality traffic patterns that fit your chart
#2: shhh.... AutoTrader should be asking you for a price increase!

Link:Google Trends: autotrader
Google Trends autotrader - Google Chrome 212012 42131 PM.bmp.jpg

You'd need Year over Year comparisons to remove this seasonality trend.
 
1st question, How is AutoTraders overall business doing? (how hard are they working for us?)

See national trend for AutoTrader
Google Trends: autotrader Look at the chart, you'll see VERY VERY STRONG GROWTH.


Ok., so so we can see people that go to Google and type in AutoTrader is trending strongly. It's not an exaggeration to say it's WAY UP. Does that translate into more VDPs nation wide? For some reason, They won't let me look at their records ;-)

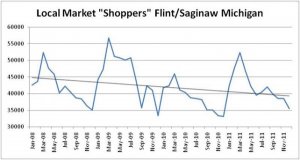
2nd question, your 3 year chart is trending lower... or is it?
Compare the last 3 years of the google national chart above against your 3 year chart. Google Chart UP, your chart DOWN. We can assume that it's likely you're looking at a local marketplace problem.

Lets look a lil' harder at your chart. Compare your MARCH PEAKS. Notice the extra soft 2010 peak. 2011 is greater than 2010.
.
Thought #1. Your spring 2010 performance was very weak and could easily cause your trendline to point lower. See spring 2008 vs spring 2011, very similar. 2009 was very strong, but not strong enough to offset the godawful 2010 numbers.
.
Thought #2. Your market may have hit bottom. Spring 2011 was CLEARLY way better than 2010
.
.
.
Also, can't get too granular with this, consider the smaller the data measured, the more erratic it becomes.