- Apr 7, 2009
- 4,985
- 2,425
- Awards
- 10
- First Name
- Joe
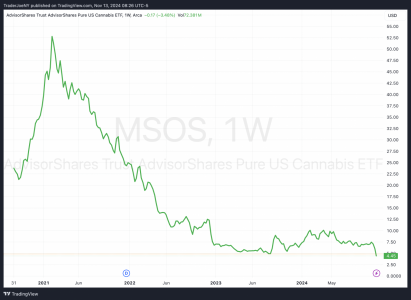
it's interesting how the 10 year treasury is up almost 20% since they started lowering the overnight rate... Thoughts??
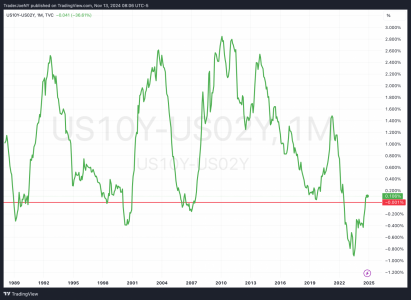
Marcy, this is my 'oh shit' chart
What's This Chart? It's the 10Y-2Y Treasury spread - basically Wall Street's favorite recession predictor. When it goes negative (like now) and then turns positive, buckle up. Changes are coming.

Recent Evidence:
The yield curve is normalizing from its deepest inversion in decades (-0.8% in 2023). Every time this happened in modern history, it warned us about major economic shifts. Think 2008 Financial Crisis, 2000 Tech Bubble, and 1990s Recession.
Historical Pattern: This indicator has called EVERY major recession since 1980. Not sometimes. EVERY. TIME.
Why Car Dealer's Should Care:
- Most dealers under 45 have never run a store in a true recession
- The Cheap money is gone, it caused dealers to create operational weaknesses
Remember: You're looking at decades of data here, this won't come over night. But... the best time to fix your roof is when the sun is shining. Our industry has been sunny for a long time. Storm clouds are gathering.
CAR SALES IS A ZERO SUM GAME.
The dealers who prepare NOW will not just survive - they'll thrive as laggard competitors wait for the good ol days to come back.
Last edited:


