Jon
I applaud your desire to track the ROI on your marketing investments. In the past we had limited visibility into the influences of traffic and conversion. Today there are some free tools and low cost data analytics partners that are giving us a much clearer picture of what is working to expose our inventory to car shoppers.
As you know, asking your sales staff to properly source ups is challenging at best and not very clean. I do respect Jerry's desire to get some feedback from the phone channel, but it's not as clean as you may like.
I did see some dealers do a better job of sourcing showroom ups. They showed each consumer a piece of paper with 4 website home page screenshots and asked them which sites they visited before coming in. The paper had Autotrader, Cars.com, Edmunds.com, and their own website. You may want to try it because the system really works well. People seem to remember "visuals" much better than a URL name.
Electronically Collected Data
As you stated, you can use Google Analytics to see
referral traffic data, as one lens. I have found is using referral traffic is very misleading. I will show you a few examples.
I would like to help you setup Google Analytics for better tracking investments without cost. If you setup Google Analytics
Multi-Channel Sales Funnels (MCSF), you can start collecting data for the last 30 days of shopper behavior as they interact with your website.
I recently restarted the Automotive SEO Study and in the first webinar last week, I walked people through how to setup Multi-Channel Sales Funnels.
The full length video link is:
Automotive SEO Study
You will just need to join the community to watch the video, but it will show you why looking at Google Analytics referrals is not a good judge of the influence of Cars.com and Autotrader.com
What Does MCSF Show You?
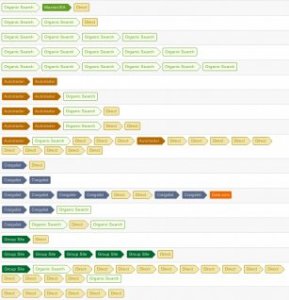
Like anything, you have to setup MCSF to align with your current digital and offline investments. Once you setup MCSF data starts to collect and in 30-60 days you can start to have a better view on consumer behavior and influence. Here is example of the assisted conversions report.

Think of each line as a conversion. For this example, let's say each line represents a lead submitted. If you use "referral" tracking on lead submission, only the LAST website in the chain of events gets the credit. So in the case of Autotrader, five consumers STARTED to know this dealer via Autotrader's exposure of the dealer's inventory or banner ads.
They clicked on the link or banner and came to the dealership website. In all but the first case, the subsequent visits were organic or direct. Autotrader does not get credit if you just look at last referral sources. Using old analytics thinking, you would attribute four of the Autotrader "started" leads to SEO or traditional branding. This is what I meant by misleading data from using traditional last "referral" metrics.
What this shows me is that Autotrader connects consumers with a car and/or the dealer's name and website. The next time(s) they wanted to learn more about the dealer or their cars, they searched the dealer's name (organic) or directly typed in their website URL (direct).
But here is the bigger point. If we can see this behavior using actual website data, how many consumers DON'T click through to the dealership website via the Autotrader VDP link and just organically search the dealership name. How many visit the dealer site on another day but remembered the dealer name from the AT VDP and have no need to go back to Autotrader.com?
The data clearly shows that this is happening on click behavior so it must be happening without direct AT to dealer website clicks as well.
Re-Thinking How Your Inventory and Brand is Exposed
If you think about it, dealers want to expose their products (cars) to as many online shoppers. Once exposed, you would expect them to come direct or organically once they know the seller's name or website. I do that all the time. I may hear of a new product via an online news story and click a link to the product website. Once there, the next time I will use the name or direct website to return.
Also keep in mind that AT and Cars.com are increasing their PPC spending on primary keywords such as "used cars" which they can easily bid the highest for in any market. They can distribute the keyword costs over millions of cars efficiently. The individual dealer may find that buying those keywords is expensive compared to the Vehicle Detail Page Views on third party classifieds that they get each month.
Is VDP View Reports Also Misleading?
Autotrader.com and Cars.com use Vehicle Detail Page Views (on their website) as one metric to show that their platform is exposing a dealer's inventory to consumers along with phone calls and direct lead submissions. This information is good but also flawed because it fails to show how these platforms influence VDP views on the dealer's website. In reality, these reports
short change Autotrader.com and Cars.com but they can't do anything about it unless dealers gave them access to their website.
There is hope if you want better answers.
Have you compared how many VDP views are happening each month on your dealership website organically vs. what you are getting on Autotrader.com or Cars.com? How many of these "organic" VDP views are actually initiated by Autotrader.com or Cars.com? You most likely don't know...but you can!

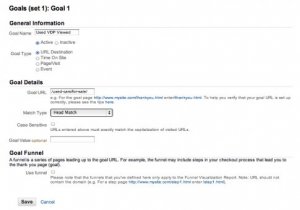
You can start to get that answers with Google Analytics "Goals" and Multi-Channel Sales Funnels (MCSF). If you setup a "goal" that is triggered anytime a VDP is viewed on your website, then you can start to see how many of those consumers STARTED on third party advertising portals, Facebook, your blog, etc.
In the example above, I went to your group site and found the URL pattern for your Used Car VDP pages. I used the "head match" parameter which allows you to identify the "starting" part of each used car VDP page. You can setup a second rule for new car VDP's and the MCSF will give you the investments and websites that influenced the VDP views.
Knowing Your Cost Per Website Visitor
Finally, I have been looking at hundreds of car dealer budgets since starting the Automotive Zero Moment of Truth Study. I look at their investments on traditional media, self managed digital strategies, and third party sites like Autotrader.com and Cars.com.
What I have found often shocks dealers. I have to ask you a question first before I share the data. Do you believe that a majority of the consumers who drive over the curb with a new or used car, will visit your website at least once before buying the car? Not all, but most will.
If that is the reality of our highly connected world, website traffic is a proxy for sales. If we drive more qualified traffic to our websites, it should increase leads and sales.
With that in mind, you already know that Google Adwords most likely averages between $1.50 - $2.00 per visitor (click) depending on your market. The cost per visitor from traditional media I have found runs between $16 - $22 per visitor. So, before you fire Autotrader.com or Cars.com, you may be kicking the wrong "dog".
If you are completely out of traditional media buying that is one thing, but most dealers are not. So, once you consider how much you are paying in traditional media costs per visitor to expose your inventory to an in market consumer, these third party advertising platforms start to have much more reasonable metrics.
I can't speak about the SUPER DUPER high end packages that Autotrader or Cars.com offers, but in most cases, I have found that you most likely fired the wrong marketing partner.
The good news is that the data will start to confirm one of our viewpoints.
I hope this enhances the discussion. We'll be diving into this type of data analysis more at the
2012 Automotive Boot Camp, May 15-17th in Las Vegas.
Brian


