• Stop being a LURKER - join our dealer community and get involved. Sign up and start a conversation.

What is your website's conversion rate?

John H

Push Start
May 13, 2020
10
4
Awards
1
First Name
John
Hey everyone!

This is my first post here! Very excited to be a part of the forum.

I've been doing some research on typical conversion rates on franchise & independent dealer websites. Dealer Inspire says that they typically see 0.55%-1.5%. DealerOn also says that 1.5% is a good place to be.

To get a more accurate and up-to-date answer, I figured that I would ask the community directly. What conversion rates are you all seeing? For this discussion, the conversion rate should be calculated as follows:

(unique sales-related lead submissions excluding phone calls/unique visitors over the past 30 days)*100 = conversion rate

I predict that this will be a tough ask due to scattered data sources and duplicate submissions.
 
Last edited:
  • Like
Reactions: Jeff Kershner
I can't say I have any recent data, but at my previous organization we had a small CRO team (this is going back to 2017-2018). One of their KPIs and tracked metrics was website conversion rate - with one of their mandates being to increase this over time and benchmark against the competition. We had a sample size of about 150 websites at the time, many were ours but we also did SEO/SEM for dealers on other website platforms so we did have representation from most of the major players (maybe 30-40 competitor websites in the sample).

My vague recollection aligns similarly with the numbers you've cited. I can't recall seeing any higher than 4% and any lower than 0.5%. There was naturally variation even within the same website platform because design-by-dealer is definitely real, but most likely fell in that 1-2.5% range.

Any reason why you exclude call conversions? With proper call tracking/recording you should be able to nail down sales calls from the website.
Hey Josh! Great information, thanks for sharing. Do you recall if there were any websites that had abnormally high conversion rates... say 10%+?

RE: exclusion of phone call conversions; this is true that you can nail down sales-related calls from the website using call tracking. However, the data I'm referencing for calls is derived from click-to-call events and isn't connected to a call recording system. I wanted to make sure that my numbers weren't calculated with a thumb on the scale.
Definitely can't say I recall any website remotely that high, at least not legitimately measured in the way you suggest. There is all sorts of analytics fugazi out there though, so nothing is surprising!

Some vendors like to advertise claims of "300% more leads" etc. with their website platform and then lock everything behind contact forms that kill UI/UX.
 
  • Like
Reactions: craigh
We are producers and quality sellers of real documents. We process and produce documents that you can use to travel and work in any part of the world. All our documents are valid and registered in the required government database system. As for our documents they are 100% real and can also be use for travel but that is done at the clients. We advice clients who want to use their documents for travel to always go in for the real documents

So If you are searching for documents, you have come to the right place! We process and produce valid personal documents such as: passports, ID cards, driver’s licenses, SNN, Birth Certificate, Covid card, Visa card, Master card, fake bank notes clones card. etc


WhatsApp: +1-551-236-4029

Email: [email protected]

Telegram https://t.me/buyidsandpassport

My name is McLovin - can you do single name docs?
 
  • Hilarious
Reactions: Kyle Gage and Jim K
Definitely can't say I recall any website remotely that high, at least not legitimately measured in the way you suggest. There is all sorts of analytics fugazi out there though, so nothing is surprising!
Subprime dealers can easily hit 10%+ conversion.

Franchise dealers tend to hover around 1-3% though.

And a lot of it ultimately depends on the traffic mix of each dealership website.

You have to look at the conversion rate by channel/source for a true apples-to-apples comparison.
 
Back when I was overseeing a Nissan dealer with Subprime Credit, we averaged 8% conversion. This prevented me (made it super difficult) from tracking a more accurate conversion rate without the Subprime. But most of the other dealer websites (all on DealerOn) averaged around 2.5% without of fancy pop-up plug-in they provided.

After years of tracking the overall conversion and not seeing where it truly tied onto Sales - I stopped tracking it. Found there to be too many variables to do anything with the metric.
 
And a lot of it ultimately depends on the traffic mix of each dealership website.

You have to look at the conversion rate by channel/source for a true apples-to-apples comparison.

Agreed. As I stated above, what can you really do with tracking the overall conversion rate of a dealer website? Break it down by channel and/or how many/what actions taken per VDP.

Erika asked me if I thought conversions have gotten better or worse during the beginning of the pandemic. My response: "I think dealers may have seen an increase early last year into the summer due to the lockdowns." @Ryan Everson did you track any change during that time?

BTW - @johnhabeck Thanks for joining the forums and posting your first "post."
 
I am constantly analyzing conversions and have been tracking them for our CDJR dealer for years. Conversions are a result of content. Is your website pushing for conversions for information? What I mean is, does your website entice and invite customers to convert? I'm always trying to find a balance between providing content to inform the consumer while simultaneously giving them a reason to call/click by holding some information back. Our site is currently converting @ 1.2% unique conversions (Jan-Sept 2021: 161,775 unique visitors vs 2,025 unique, first-in, inquiries). I also do not count website forms/calls where a live inquiry already exists in the last 30 days (cars.com inquiry results in website form inquiry-we do not count the website conversion) so our actual conversions would be 2.4% (4,020 total website conversions over same period).

There are a few ways, I've learned from over the years, to help increase conversions. Providing a single name for contact on your website will increase conversions. "Price is not valid unless confirmed by Ian Deveroux" will convert more consumers instead of "Ask for the Internet Department" or "Call one of our Sales Consultants". "Price subject to change and/or error" added to our conversions. Just as important are your color schemes. Ask your website provider to do A/B testing on button colors (red vs. green). You may be shocked at how conversions change just from the color of buttons. CTA's on your buttons can also make a HUGE difference. Change it up (Call for Price, Confirm Price, etc...) I've even tested "Free Puppies" as a CTA on a button and had quite a few clicks for free puppies with consumers laughing along "you just wanted me to click, right".

Lastly, look at embedding hotjar script. It's free and can give you insights on traffic behavior. Use heatmaps to see how consumers mouse movements on your VDP or SRP pages are performed. Do they hover over your CTA buttons or not? If not, rethink the buttons (colors/CTA's).
 
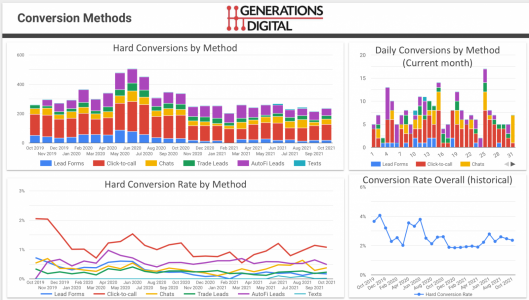
Monthly_Analytics_Express_Report_›_Conversion_Methods.png

We break out conversion rate for dealers in Google Data Studio, here is an example. Breaking out conversion rate by each conversion method allows you to see if a particular conversion method may be broken, or implemented poorly.

For instance, we know trade-in tools perform within a conversion percentage range at most dealer websites. We are fans of TradePending and others, and when we find a new dealer that has a lower percentage than the rest of the country, we dig in and find out why. Perhaps the link is not on the SRPs, or is too far down on the homepage. Contact your TP rep, or digital retail support rep if your conversion rates are lower than they should be.

Overall, our goal is 2% or above, but that can be hard for dealers who don't want chat/text or DR tools. For a dealer with multiple methods, maybe 3% or above. Of course this past Spring and Summer saw much higher conversion rates, and also a higher conversion rate for new vs. returning users, which can show a shortening sales cycle. Lately returning user conversion rates are climbing back, showing potential market softening, longer sales cycles.