The most succinct answer is the obvious one; Because they WANT to be.
You are using an out of date browser. It may not display this or other websites correctly.
You should upgrade or use an alternative browser.
You should upgrade or use an alternative browser.
Why are Car Shoppers are so Damn Invisible?
- Thread starter joe.pistell
- Start date
- Jan 21, 2015
- 14
- 7
- First Name
- Scott
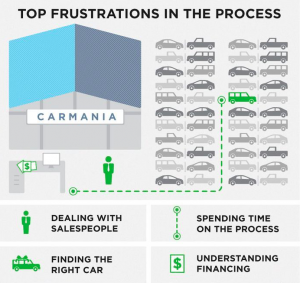
I think this infographic does a great job of what we as dealerships need to understand about our consumers.
If our web sites can help reduce these anxieties for our consumers, they will tell us who they are in greater numbers.
If our web sites do not, these people will remain anonymous.
If our web sites can help reduce these anxieties for our consumers, they will tell us who they are in greater numbers.
If our web sites do not, these people will remain anonymous.
Attachments
No offense but that is one of the worst infographics i think ive ever seen. I mean its really just a list of the top 4 things people hate about car shopping. Infographics are for taking complicated data and presenting it in a simple graphical easy to understand fashion.I think this infographic does a great job of what we as dealerships need to understand about our consumers.
If our web sites can help reduce these anxieties for our consumers, they will tell us who they are in greater numbers.
If our web sites do not, these people will remain anonymous.
FWIW i agree with the 4 points!
No offense but that is one of the worst infographics i think ive ever seen. I mean its really just a list of the top 4 things people hate about car shopping. Infographics are for taking complicated data and presenting it in a simple graphical easy to understand fashion.
FWIW i agree with the 4 points!
If there's no part of that infographic that is missing, I have to agree. It's a graphic for the sake of being a graphic.
Points are good.
- Jan 21, 2015
- 14
- 7
- First Name
- Scott
I take no offense on the info graphic, i didn't create it. I did pull it out of context of a larger graphic to illustrate the point. Stick to the 4 points, give people a what's in it for them reason that you are addressing the 4 points on your website through content, tasks and data. You will be on the right track to more leads.No offense but that is one of the worst infographics i think ive ever seen. I mean its really just a list of the top 4 things people hate about car shopping. Infographics are for taking complicated data and presenting it in a simple graphical easy to understand fashion.
FWIW i agree with the 4 points!
Surveys, ugh. If you can't get the answers you need from a customer in 5 questions/2-3 minutes, you are not gonna get truthful answers (IMO).
- Apr 7, 2009
- 4,985
- 2,425
- Awards
- 10
- First Name
- Joe
Surveys, ugh. If you can't get the answers you need from a customer in 5 questions/2-3 minutes, you are not gonna get truthful answers (IMO).
Depends on the context.
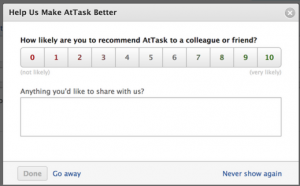
IMO a car shopper on the web is good for one question, but if it's a niche specialty site, the visitor is far more connected and is more willing to "help" the site out. I added my favorite web shopper form JIC someone wants to DIY.
Attachments
- Apr 7, 2009
- 4,985
- 2,425
- Awards
- 10
- First Name
- Joe
Look what I just found!

https://www.google.com/webhp?source...=UTF-8#q=new+restaurant+near+essex+vt&spell=1
Nailed it! Context Matters!

https://www.google.com/webhp?source...=UTF-8#q=new+restaurant+near+essex+vt&spell=1
Nailed it! Context Matters!
I'm just thinking more along the lines of those exit surveys after the customer has purchased and is anxious to hop in their new ride! Or post sales surveys that get emailed to the customer a few days later. When they are over the sale-honeymoon and ready to get back to real life.
But yes, context matters.
But yes, context matters.
Does it surprise anyone that customers WANT to remain anonymous? Historically the folks that are most apt to submit a 'form-fill' lead are the folks that only want to get a price to shop, whether it is against a local dealer or against multiple online dealers looking for the lowest possible price. That is why it is such GOOD NEWS that the traditional 'form-fill' lead constitutes such a small fraction of the online activity you see as a dealer. These aren't anywhere near your best prospects.
The problem is, when a customer raises his or her hand and says, I have a question - here I am - most dealers really work overtime to get the prospect into the store. Just Get Em In...
...and everything that they DON'T LIKE happens at the dealership.

The problem is, when a customer raises his or her hand and says, I have a question - here I am - most dealers really work overtime to get the prospect into the store. Just Get Em In...
...and everything that they DON'T LIKE happens at the dealership.


