• Stop being a LURKER - join our dealer community and get involved. Sign up and start a conversation.

Cars.com BIG DROP since new design?

@LotPop Jansen, I got a PM from a DR buddy, he saw a different UI then I posted. Do we have evidence that Cars.com is split testing the UI :)


#1) Home page search facet defaults
BEFORE:
upload_2016-3-24_7-37-35-png.2812

AFTER:
upload_2016-3-25_9-29-32.png


#2) A Different SRP search facet UI
BEFORE:
Note: The SRP search facets are on the bottom of the page
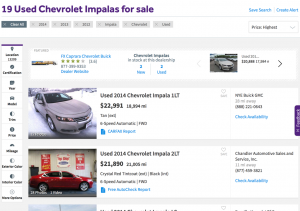
AFTER:

upload_2016-3-25_9-36-16.png
IMO, MUCH MUCH MUCH BETTER UX

New SRP UI Summary: I find this side nav bar to be easy to scan, easy to use, and powerful (multi-select facets). The top nav elements are easy to identify and easy to use. This is a big win IMO.


Noise in the historical data

  • We don't know if we're seeing a split test or a launch of new UI. If it's a split test, this may be an ongoing affair, meaning the historical data you're looking at can have all kinds of UI variations in it.


We don't know if we're seeing a split test or a launch of new UI. If it's a split test, this may be an ongoing affair, meaning the historical data you're looking at can have all kinds of UI variations in it.

Yes @JoePistell and maybe since Autotraders lawsuit on their stats maybe cars.com are cleaning theirs up???
I am not accusing (because I am hoping neither company was doing) but definitely something that all providers need to make sure are accurate especially if that is one of the main sources (data points) for what they charge their dealers
 
There seems to be something going on with Cars.com stats since the change to their new site layout. I help about 2 dozen dealerships in all different markets and they all carry different franchises and I am seeing the same trends at these stores.

I want to open up this conversation to see if anyone else is seeing the same trends?


I'm seeing a big drop in SRPs and VDPs, and not just on an overall drop but on a per car drop also.

Chart 1 shows a drop in weekly projected SRPs for this dealership's inventory.
Chart 2 shows the same dealerships weekly drop in projected VDPs.
Chart 3 shows the drop in those VDPs on a per car basis.

View attachment 2803

View attachment 2805

View attachment 2804

As you can see by comparing the trends to their Autotrader stats, it's not an inventory issue because if that were the case, both Autotrader and Cars.com would have dropped at the same level.

(these are charts created in Google Drive for our clients, the projected data is pulled out of vAuto’s Merchandising tool that gets a feed from Cars.com and the monthly data comes from Cars.com and Autotrader.com backend tool)

I'm also seeing a drop in VDP conversion percentage.

View attachment 2806
View attachment 2807


I'm also tracking a drop in leads coming to the stores.

View attachment 2808
View attachment 2809

All of this is coming at a time of the year where there is usually a spike in shoppers on both Autotrader.com and Cars.com. The months of January, Febuary and March show the largest shopper count year over year on Autotrader.com and Cars.com as you can see from the charts below..

View attachment 2810
View attachment 2811


Anyone else is seeing the same trends?
gsvtht n
I noticed same thing a few weeks ago and asked our cars.com rep to explain. He came back with comments about inventory levels, photos, all things that had not changed. still
There seems to be something going on with Cars.com stats since the change to their new site layout. I help about 2 dozen dealerships in all different markets and they all carry different franchises and I am seeing the same trends at these stores.

I want to open up this conversation to see if anyone else is seeing the same trends?


I'm seeing a big drop in SRPs and VDPs, and not just on an overall drop but on a per car drop also.

Chart 1 shows a drop in weekly projected SRPs for this dealership's inventory.
Chart 2 shows the same dealerships weekly drop in projected VDPs.
Chart 3 shows the drop in those VDPs on a per car basis.

View attachment 2803

View attachment 2805

View attachment 2804

As you can see by comparing the trends to their Autotrader stats, it's not an inventory issue because if that were the case, both Autotrader and Cars.com would have dropped at the same level.

(these are charts created in Google Drive for our clients, the projected data is pulled out of vAuto’s Merchandising tool that gets a feed from Cars.com and the monthly data comes from Cars.com and Autotrader.com backend tool)

I'm also seeing a drop in VDP conversion percentage.

View attachment 2806
View attachment 2807


I'm also tracking a drop in leads coming to the stores.

View attachment 2808
View attachment 2809

All of this is coming at a time of the year where there is usually a spike in shoppers on both Autotrader.com and Cars.com. The months of January, Febuary and March show the largest shopper count year over year on Autotrader.com and Cars.com as you can see from the charts below..

View attachment 2810
View attachment 2811


Anyone else is seeing the same trends?
I noticed the same thing a few weeks ago and asked our cars.com rep to investigate. He came back with comments about inventory levels, picture, etc none of which had changed significantly. They seem to be more mobile focused could it be they are not picking up hits from mobile devices?
 
I've been looking at this too pretty hard, and I can't seem to identify a traffic drop or trends from my stores with cars.com traffic to the website.

I did notice that the way my in-house analytics is tracking cars.com referrals has changed, and it appeared as though traffic just stopped around February 24. I dug into it and seems cars.com added a UTM tag to the website links: somedealerwebsite.com/?utm_source=cars.com&utm_medium=referral
upload_2016-3-25_12-47-11.png

No change with google analytics for cars.com tracking, you can check it with campaigns now though.
upload_2016-3-25_12-52-15.png

I'm beginning to think it's maybe a tagging or tracking issue, could even be with mobile devices too.
 
What is your point @JoePistell ? I don't look at what Cars.com is doing from a user experience standpoint. It's a product. If they change their interfaces, that's on them. Dealers and their agencies should look at the costs per lead and ultimately costs per sale (ROI) and judge them accordingly. Along with all other 3rd party inventory listing applications. That said, I do see less leads coming through than normally. That could be attributed to many reasons, but I don't own or work for a company that does usability studies.
 
Last edited:
...I'm beginning to think it's maybe a tagging or tracking issue, could even be with mobile devices too.

Interesting skutch, keep us in the loop.

-----SIDEBAR-----

It amazes me how few car shoppers visit car dealer websites via 3rd party aggregator VDP links. Also, It's fascinating how this disconnect does not happen with other aggregators like Kayak(air travel) or Zillow(real estate).

For insights, juxtapose this evidence against the survey-at-delivery where car buyers claim they were on the dealer's site multiple times and many buyers recall being on AT, Cars & Gurus. Why aren't MORE shoppers visiting dealer's sites via the VDP link? The shopper is telling us "why go to the dealer's site? I find no reason to go now", or, "I kept seeing cars from 'SomeDealersName' on the aggregator(s), so I googled that dealer (a SRP experience).

My instincts are telling me there's an 'undiscovered disconnect in car shopper workflow' that's not being addressed with AT, Cars & Gurus. Possibly, Jasen's platform may help bridge this disconnect.
 
When it comes to Cars.com drop off in leads a big chunk of that is coming from a drop off in map views like the charts show below, but that does not change the drop off in VDPs and VDP%. Cars.com traffic is good and up for Jan, Feb and March for most stores I am looking at so some stores have a stable SRP stat, its just the VDPs and the leads that are way off and that is what matters the most
 

Attachments

  • upload_2016-3-28_11-4-21.png
    upload_2016-3-28_11-4-21.png
    144.4 KB · Views: 3
  • Like
Reactions: skutchhenks
-----SIDEBAR-----
It amazes me how few car shoppers visit car dealer websites via 3rd party aggregator VDP links.
Yes, that's a total anomaly, I think it's a few things with shoppers; it's about trust, not really knowing market pricing (what's good or bad deal?), knowing the inventory rapidly changes, or actually how these car shopping sites work.

When I've asked customers (friends, family, etc) about why they don't just click the button on car shopping sites, I hear:
  • I didn't want to lose my place on the website I was on (scanning a list of vehicles), and I can always visit the dealer website later.
  • I wanted to see if the price was the same on the dealers website, so I googled their name and found the actual vehicle to see if the prices match.
  • I wanted to google the dealer name and pull up the same vehicle (also keep the same window open on the other website) to compare things.
  • Google the dealer name and to see if the car was still in stock.
I think this is a reason why our websites look like they're crushing it, they get to the site and then fill out a form. Which give us the feeling that maybe we don't need 3rd party websites. Online attribution in this business is like ghost hunting.