






• This thread is just the tip of the iceberg.The people ahead of the curve aren't Googling for answers — they're already in here, having the conversations you haven't found yet. DealerRefresh is free.Get the full picture →

Internet Close Percentage Math - Two Formulas?

Which do you prefer? Do you calculate close rates by Sold in Timeframe or Sold from Leads?

  • I'm a Vendor and we prefer Sold in Timeframe.

    Votes: 0 0.0%
  • I'm in Retail and we prefer Sold in Timeframe.

    Votes: 0 0.0%
  • I'm a Vendor and we prefer Sold from Leads.

    Votes: 0 0.0%
  • I'm in Retail and we prefer Sold from Leads.

    Votes: 0 0.0%
  • I don't think it matters.

    Votes: 0 0.0%

  • Total voters
    0
I did not use my vendor brain to answer you. This is how I did it at Checkered Flag and how I do it to measure our own advertising at FRIKINtech.

But you're now asking about salespeople.

Other than attribution, I don't think there is a difference in measuring. I would measure a salesperson's close rate based on how many NEW customers (leads/opportunities) they worked vs. how many deals they sold in that calendar month.

@Rob stated it simply.
You both started talking about attribution and closing from an advertising lens LOL. I was looking for just an answer of "Sold from Leads" or "Sold in Timeframe" within the Retail scenario in the post. If the Poll was working, I would have been able to force the simple answer ;). Looks like you're team "Sold in Timeframe" (within the Retail scenario) from your answer. Thanks @Alex Snyder. Only love coming your way.
 
  • Like
Reactions: Alex Snyder
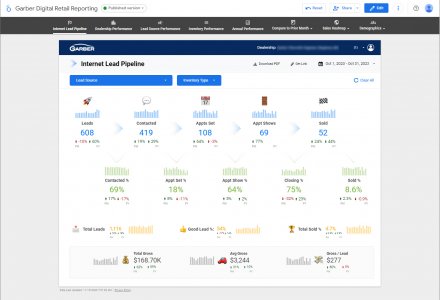
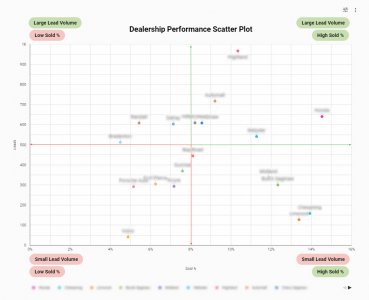
wow, bad a** scatter plot RE. I'll add a twist to this.

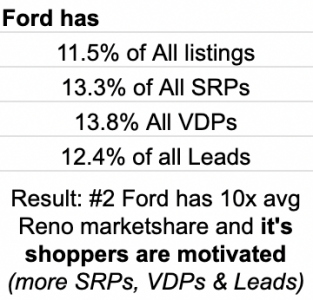
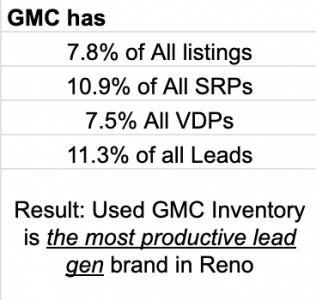
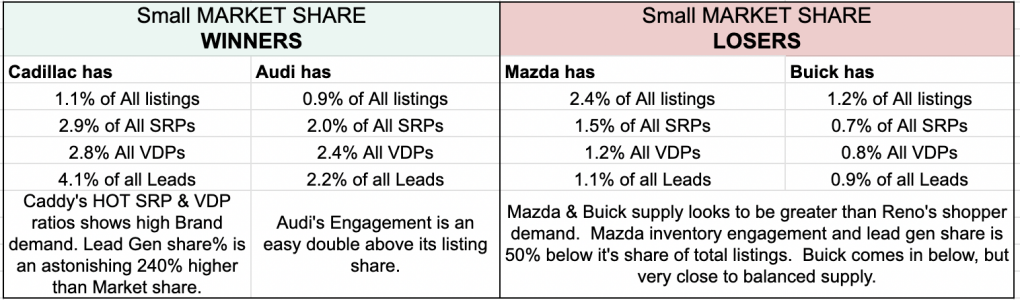
UC Product profile leads itself to lead gen. Is a SUPPLY vs DEMAND report*:

Reno NV: 32 Brands • Median Marketshare 1.3%

WINNER:
1700058470255.png

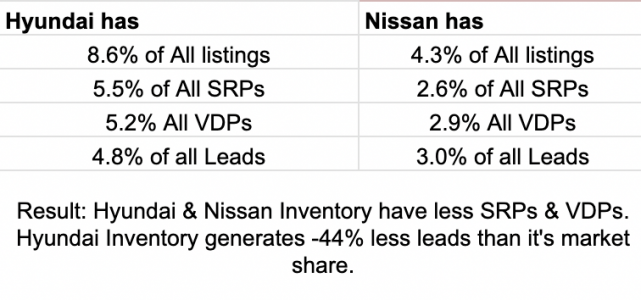
LOSERS:
1700058573808.png

WINNER:
1700058293115.png
Take away: Identical counts of Ford and GMC used create >2x leads vs Hyundai & Nissan

Every market is unique, each marketplace has winners and losers in the lead gen race. The inventory mix can swing lead gen rates, and possibly the closing rates too.
1700059069554.png

*I made a custom report using CARS Commerce data. Its an eye popper.
 
Last edited:
And a scatter plot that makes it easy to visualize where stores fall in regards to lead volume and sold %.

View attachment 8268
I made one of these for Internet and Phone for Salespeople. Eye-opening for their managers to see their teams and where they compare. I used the "Impact" awareness that you get from a low volume of leads, low performer vs high volume of leads, low performer. It gave the managers a place to start their coaching on where they were "bleeding". Coach the highest impact/low performers first.
 
  • Great Idea
Reactions: Ryan Everson

✨ AI Highlights

  • The thread debates two competing formulas for calculating Internet lead close rates in retail dealerships: "Sold from Leads" (sales only from prospects in that month's lead count) versus "Sold in Timeframe" (all sales in a given period regardless of when leads arrived).
  • A consensus emerges that "Sold in Timeframe" is the correct approach for measuring salesperson performance, as it provides stable, non-fluctuating monthly metrics and avoids the problem of past months' data constantly changing.

The thread debates two competing formulas for calculating Internet lead close rates in retail dealerships: "Sold from Leads" (sales only from prospects in that month's lead count) versus "Sold in Timeframe" (all sales in a given period regardless of when leads arrived). A consensus emerges that "Sold in Timeframe" is the correct approach for measuring salesperson performance, as it provides stable, non-fluctuating monthly metrics and avoids the problem of past months' data constantly changing.

Replies Views 16 6,091 Started Last Reply