I would love to hear the responses from asking the 4 questions above. If you ask please post how they answered
You are using an out of date browser. It may not display this or other websites correctly.
You should upgrade or use an alternative browser.
You should upgrade or use an alternative browser.
D.R. Truth - ask him anything!
- Thread starter Alex Snyder
- Start date
- May 1, 2006
- 3,843
- 2,823
- Awards
- 13
- First Name
- Alex
Hey @jon.berna - was just thinking in regards to a lease penetration thread that it would be interesting to come up with a few buckets we could divide certain brands into. To the best of my knowledge, the companies sitting on these numbers don't publicize them by brand too often. They just publicize a few outliers.
For example:
With those buckets in place we could look at the dealers who are outliers. What are they doing differently? Are there any commonalities? Can we get them to participate on DealerRefresh? Take it to a whole new level!
For example:
- If one bucket contained brands that don't traditionally lease well like Hyundai and Kia it could be the lower-penetrating brands bucket.
- And then the next tier might be Toyota, Honda, Ford, etc. where we have the average-penetrating bucket.
- Finally the BMW, Mercedes, Cadillac zone where nearly every deal that isn't cash is a lease.
With those buckets in place we could look at the dealers who are outliers. What are they doing differently? Are there any commonalities? Can we get them to participate on DealerRefresh? Take it to a whole new level!
- Feb 11, 2015
- 2,492
- 765
- First Name
- Alex
- Apr 7, 2009
- 4,984
- 2,424
- Awards
- 10
- First Name
- Joe
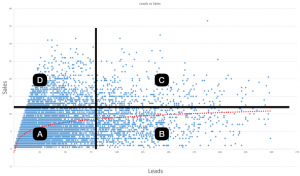
Wow Jon, This is cool! I take it that EACH dot is a sales rep that plots how many sales the rep made and how many leads they consumed. Correct?
Real quick chart on the relationship between leads and sales and how it is a logarithmic function. This is non-showroom leads vs sales.

- Apr 7, 2009
- 4,984
- 2,424
- Awards
- 10
- First Name
- Joe
If I am correct (dot = # of sales from 1 rep & # of leads that rep used) then this chart fires off this idea...
Where
If selling cars is a team sport, then A, B, C & D are all a product of management's skills.
That was fun! Jon, I eye-balled the grid, if you run with this idea, it'll be interesting what else you'll find.
Where
A = 80% of all reps (i.e. the 8 a month'er)
B = Reps burning thru leads with aweful closing ratios
C = Reps burning thru leads with higher closing ratios
D = RockStars
B = Reps burning thru leads with aweful closing ratios
C = Reps burning thru leads with higher closing ratios
D = RockStars
If selling cars is a team sport, then A, B, C & D are all a product of management's skills.
- B&C happen when a GSM/GM never looks at reporting
- A is every dealer's sales training challenge
- D is every dealer's dream team.
- Advertising ROI is directly tied to the dealer's pattern/profile.
- Which may cause a dealer to realize
- "Adding more leads is NOT your problem...
- Moving leads from reps in B&C to reps in A&D will get you more sales
- etc...
That was fun! Jon, I eye-balled the grid, if you run with this idea, it'll be interesting what else you'll find.
Last edited:
- Feb 11, 2015
- 2,492
- 765
- First Name
- Alex
http://content.drivendataconsulting.com/3rd-party-classified
2018 3RD PARTY CLASSIFIED PERFORMANCE
We compiled nearly 300,000 third-party leads from 2018 and broke them all down by appointment metrics, amount sold, quality leads (two forms of contact), and overall conversion. We even took it a step further to show the total and average gross profit made from each lead source.
- Autotrader.com
- CarGurus.com
- Cars.com
- Edmunds
- TrueCar
- May 1, 2006
- 3,843
- 2,823
- Awards
- 13
- First Name
- Alex


