• Stop being a LURKER - join our dealer community and get involved. Sign up and start a conversation.
You read my mind. We have dozens of dealerships that we want to report on - AdWords-CTR, CPL, Spend, Impressions share, and Analytics-time on site, bounce rate, pages viewed, etc. etc.

It looks like I'm going down the same route you already forged! Thanks again. Big help.
 
Hi Mark, nope I'm just using the Supermetrics for Google Drive Pro plan for $49 /month:
https://supermetrics.com/product/supermetrics-for-google-drive/

The Supermetrics data grabber tools are a la carte and only work with Microsoft Excel which you won't be able to access from Data Studio. The price difference between the Google Drive and Excel versions is definitely crazy. Luckily you only need the less expensive Google Drive (Sheets) subscription.
Yes, that's all you need unless you are doing something very specific.
 
Thanks for the template Alex! Data Studio seems to gain more popularity. Yet I'm still waiting for more development (e.g: data sources, date format error, etc) as right now it is no where as dynamic as other visualization tools, like Klipfolio. But since now it's free, it's a good idea to start playing with the tool, plus I personally enjoy their interface and find it quite easy to create good-looking reports.

I just also shared a Google Data Studio template for Facebook Ads on another thread, would be great to hear your opinion on that:
https://forum.dealerrefresh.com/threads/using-google-data-studio-for-ppc-reporting.5235/
 
Just thought I'd post a quick update on our progress with the report!

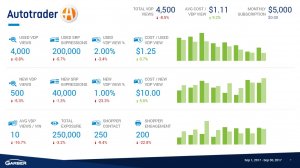
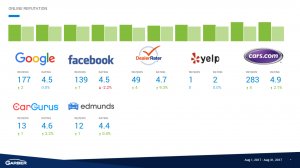
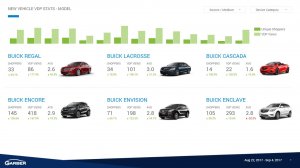
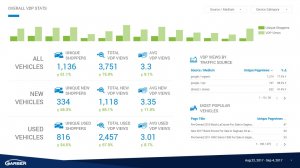
We have 18 pages to the report for each store, pulling in data from a myriad of sources like Google Analytics, Adwords, reputation, CRM, third party listing sites, etc.

It finally allows us to show everything in an easy to interpret format without needing an advanced degree in Google Analytics or compiling data from 5 different sources.

Also they have new interactive data filter dropdowns that allow you to really drill down the report even more. For example I could choose to only show the stats on paid search traffic or by device type.

PS: screenshots are sample data

autotrader.JPG reputation.jpg vdp-stats-model.JPG vdp.JPG
 
Just thought I'd post a quick update on our progress with the report!

We have 18 pages to the report for each store, pulling in data from a myriad of sources like Google Analytics, Adwords, reputation, CRM, third party listing sites, etc.

It finally allows us to show everything in an easy to interpret format without needing an advanced degree in Google Analytics or compiling data from 5 different sources.

Also they have new interactive data filter dropdowns that allow you to really drill down the report even more. For example I could choose to only show the stats on paid search traffic or by device type.

PS: screenshots are sample data

View attachment 3317 View attachment 3318 View attachment 3319 View attachment 3320

That looks great!! Nice job.
 
Just thought I'd post a quick update on our progress with the report!

We have 18 pages to the report for each store, pulling in data from a myriad of sources like Google Analytics, Adwords, reputation, CRM, third party listing sites, etc.

It finally allows us to show everything in an easy to interpret format without needing an advanced degree in Google Analytics or compiling data from 5 different sources.

Also they have new interactive data filter dropdowns that allow you to really drill down the report even more. For example I could choose to only show the stats on paid search traffic or by device type.

PS: screenshots are sample data

View attachment 3317 View attachment 3318 View attachment 3319 View attachment 3320


How did you pull this all in? Is it possible to share your template so other people might be able to use it?
 
How did you pull this all in? Is it possible to share your template so other people might be able to use it?
A combination of Google Analytics, Google Sheets scripts, and SuperMetrics. Some of the data (like Autotrader) is being inputted into Google Sheets manually by my team each month. Takes us just a few minutes to input it at the beginning of every month but worth the work because it puts it in a consistent easy to read format without all of the other extraneous stats Autotrader, Cars.com, etc like to push down our throats.

Below is what the Google Sheet looks like for Autotrader, then Data Studio pulls it from there

google sheets.JPG
 
Last edited: