- Mar 21, 2012
- 1,090
- 1,447
- Awards
- 10
- First Name
- Ryan
It's been almost 3 years since we've started using Data Studio and I'm excited to share some of our group's tips and tricks at Driving Sales in October!
It's been almost 3 years since we've started using Data Studio and I'm excited to share some of our group's tips and tricks at Driving Sales in October!
Thanks! We winged it for the most part and our videographer knocked it out in about an hour. Turned out much better than expected!Wow Ryan, the choreography/storyboarding was 1st class. Really great story telling and vid work too!
GOOGLE DATA STUDIO HACK
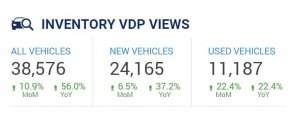
By default, Google Data Studio forces you to choose between either a Month over Month or Year over Year comparison (the up/down red/green arrows below each scorecard metric).
However, dealerships typically want to see how they compare to BOTH the prior month AND the prior year.
To accomplish this, all you have to do is:
1) Duplicate the scorecard metric
2) Change the comparison date range
3) Set the label font color to white so the only thing left visible is the second set of comparison up/down arrows
4) Add text below each comparison metric to distinguish between MoM vs YoY
View attachment 4241
First, Ryan, great video! Dealerships definitely need more helpful information like that. Wishing you luck in your DSES session!GOOGLE DATA STUDIO HACK
By default, Google Data Studio forces you to choose between either a Month over Month or Year over Year comparison (the up/down red/green arrows below each scorecard metric).
However, dealerships typically want to see how they compare to BOTH the prior month AND the prior year.
To accomplish this, all you have to do is:
1) Duplicate the scorecard metric
2) Change the comparison date range
3) Set the label font color to white so the only thing left visible is the second set of comparison up/down arrows
4) Add text below each comparison metric to distinguish between MoM vs YoY
View attachment 4241
That is definitely one area that Data Studio is lacking a little in.I have two quick questions folks.
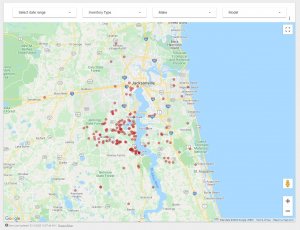
1) Any of you guys using Geocoding in GDS and taking it to the zipcode level? I'm looking at building a map with data points on it in GDS and I would like to take it down to the zipcode level. From what I've found so far, I would have to use Lat and Long coordinates in the data. Any of you guys doing anything like this currently???
NEW GOOGLE DATA STUDIO FEATUREThat is definitely one area that Data Studio is lacking a little in.
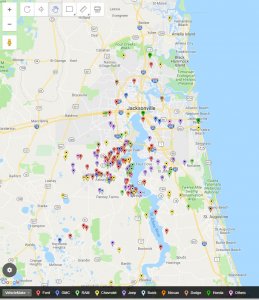
We use BatchGeo to upload our sales data down to the address level and it allows us to easily filter by New vs Used, Make, salesperson, etc.
Then we insert the screenshot into Data Studio monthly and include a link to the interactive BatchGeo map.
View attachment 4246
