

- Nov 4, 2026
- 3
- 0
- Awards
- 1
- First Name
- Ibrahim
Closing % by source is the right lens, but a lot of buyers never submit a form at all, so every source looks worse than it is.

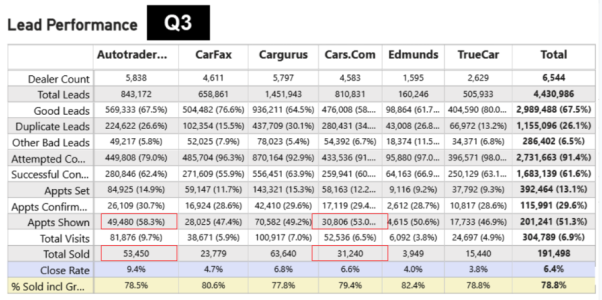
Dealers debate which third-party lead sources deliver the best ROI, anchored by Q3 close-rate data showing AutoTrader leading at 9.4% and TrueCar trailing at 3.8%. The conversation quickly expands beyond raw close rates into cost-per-sale economics, attribution reliability problems in CRM systems like VinSolutions, and the strategic value of third-party sites for capturing high-funnel shoppers who won't visit dealer websites. The key takeaway is that close rate alone is an incomplete metric — cost per lead, attribution accuracy, and upper-funnel brand visibility all need to factor into any decision to cut or consolidate third-party spend.