• Stop being a LURKER - join our dealer community and get involved. Sign up and start a conversation.

CarGurus - significant drop in traffic?

kevinfrye

Sr. Refresher
Apr 7, 2009
266
203
Awards
1
First Name
Kevin
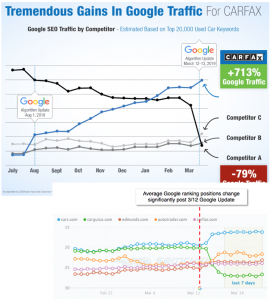
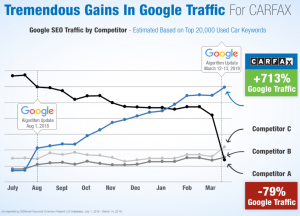
Had a visit with CarFax and they shared this graphic below, which indicates that recent changes to the Google algorithm has created a huge drop in traffic with CarGurus (competitor A) down to the level of AutoTrader and Cars.com. Source is SEMrush. Not sure how accurate this is - curious as to everyone's thoughts - especially in light of the 30% rate hike that CarGurus has been hitting dealers with in the first quarter of this year.
upload_2019-4-2_9-6-42.png
 
  • Like
Reactions: Ian Isch
I haven't been at CG for a while now, but I think the CarFax slide may be a little misleading, in that the chart only shows the traffic for the top 20,000 keywords, whereas CG, if I'm not mistaken, bids on millions and millions of keywords. The CarFax slide may be accurate for those top 20,000 keywords, but when looking at the whole picture (ie millions of keywords) the traffic hit may not be significant.
 
  • Like
Reactions: Alexander Lau
@Colin Rodger, Thank you. I think you may have partially answered the question I hadn't yet asked. I love DealerRefresh!

Similar results on the graph despite a smaller subset of keywords doesn't feel misleading to me, so long as the smaller set is relevant. That appears to be the case since the dip for CG looks consistent in both.

If I'm wrong someone please correct me. I'm here to learn.
 
It's important to establish a distinction in the reports between a percentage of change compared to a prior period versus the variable trended. Say for example you hear a city's murder rate is up 266% versus last year, at first glance it sounds like a war zone right?

That could be 3 in 2017 and 11 in 2018, so in this case the percentage of 266% over-emphasizes the change versus the underlying values.

This makes a provider starting from a lower prior period look better in YOY change when the totals are a different story. It it feels like data spin...
Absolutely, it can be spun to make themselves look fantastic.