

- Nov 4, 2026
- 4
- 0
- Awards
- 1
- First Name
- Ibrahim
Closing % by source is the right lens, but a lot of buyers never submit a form at all, so every source looks worse than it is.

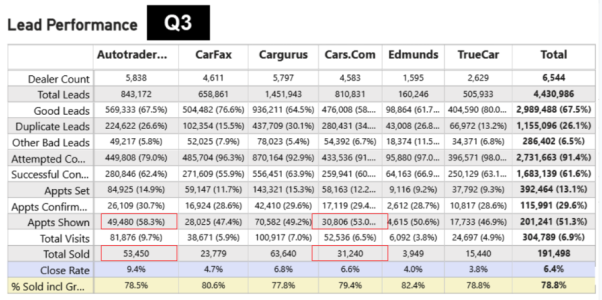
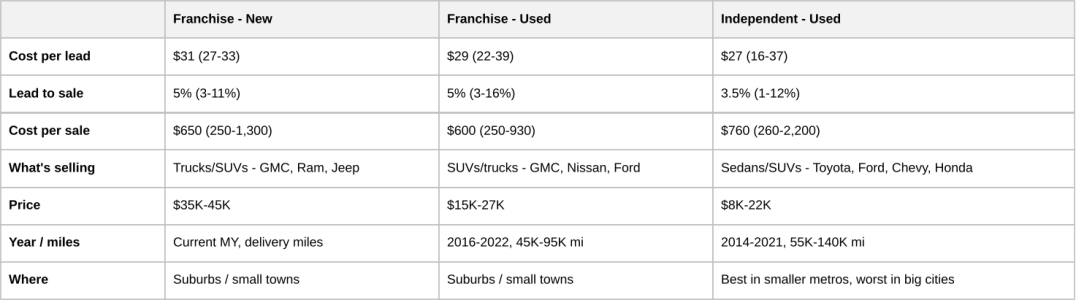
Dealers discuss which third-party lead sources perform best, with Q3 close rate data showing Autotrader leading at 9.4% and TrueCar trailing at 3.8%. A key insight is that raw close rates are misleading without factoring in cost per lead — at $50 per lead, the average effective cost per vehicle sold across platforms runs around $781 — and attribution data is further distorted by single-source CRM systems, alphabetical drop-down bias, and customers naming big-brand sites they recognize rather than the actual ad they clicked. Practical advice includes using an LLM to analyze a full year of lead data before cutting any provider, and noting that high-funnel car shoppers browse third-party and OEM sites rather than dealership websites.