#RefreshFriday Merchandizing - Someone is Launching a new Service | Joe Pistell

damn, that rant was a good thread.

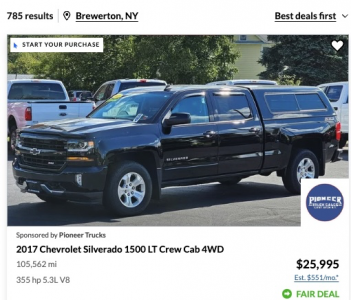
DR share: Great photo & merchandising!
Ken Grody Ford Carlsbad
https://www.cargurus.com/Cars/m-Ken-Grody-Ford-Carlsbad-sp85323
Everywhere I look, it's easy to see, this dealer has a great team and they're executing at a high level.
You don't want to be in the same market as this player.

When you make a transit van look this good... :bow::bow::bow:

1708738097653.png
  • Like
Reactions: Chris Cachor

#RefreshFriday Merchandizing - Someone is Launching a new Service | Joe Pistell

damn, that rant was a good thread.

DR share: Great photo & merchandising!
Ken Grody Ford Carlsbad
https://www.cargurus.com/Cars/m-Ken-Grody-Ford-Carlsbad-sp85323
Everywhere I look, it's easy to see, this dealer has a great team and they're executing at a high level.
You don't want to be in the same market as this player.

#RefreshFriday Merchandizing - Someone is Launching a new Service | Joe Pistell

#UncleJoeRant. (5 of 5)
To determine the "Internet Walk-in" sales ratio from monthly VIN sales, follow the steps outlined below, using the defined variables and formulas.

Definitions:
  • V = Total sales of VINs a month (e.g., 100 VINs)
  • B = Percentage of buyers who were on the site prior to purchase (from survey, e.g., 80%)
  • L = Sales rate of BDC/Lead Gen as a percentage of total store sales (e.g., 20%)
Objective:
Calculate the "Internet Walk-in" sales ratio, which represents the percentage of total sales made by customers who visited the website before purchasing but were not accounted for through BDC/Lead Gen efforts.

Steps:
  1. Calculate Buyers on Site Prior to Purchase:
    • Formula: Buyers on site = V * B
    • This step determines the number of buyers who visited the site before making a purchase.
  2. Find BDC/Lead Gen Sales:
    • Formula: BDC/Lead Gen sales = V * L
    • This calculates the sales attributed directly to BDC/Lead Gen efforts.
  3. Calculate "Internet Walk-in" Sales:
    • Formula: Internet Walk-in sales = (Buyers on site) - (BDC/Lead Gen sales)
    • By subtracting BDC/Lead Gen sales from the total buyers on site, we find the number of "Internet Walk-in" sales.
  4. Determine "Internet Walk-in" Sales Ratio:
    • Formula: "Internet Walk-in" sales ratio = ((Internet Walk-in sales) / V) * 100%
    • This final step calculates the "Internet Walk-in" sales ratio as a percentage of all sales.
Final Formula:
  • "Internet Walk-in" sales ratio = (B - L) * 100%
Example Calculation:
If B = 0.80 (80%) and L = 0.20 (20%), then the "Internet Walk-in" sales ratio is calculated as:
  • "Internet Walk-in" sales ratio = (0.80 - 0.20) * 100% = 60%

#RefreshFriday Merchandizing - Someone is Launching a new Service | Joe Pistell

#UncleJoeRant. (4 of 5)

How big is your invisible walk-in audience? 60% of total Sales?​

Do the math. Let's say you sell 100 VINs a month...
  1. Survey your BUYERS, before delivery, ask "were you on our website prior to purchase? (yes or no)"
  2. Take the "yes" count and from this remove the total sales count from BDC dept.
  3. Done.

#RefreshFriday Merchandizing - Someone is Launching a new Service | Joe Pistell

#UncleJoeRant. (1 of 5)
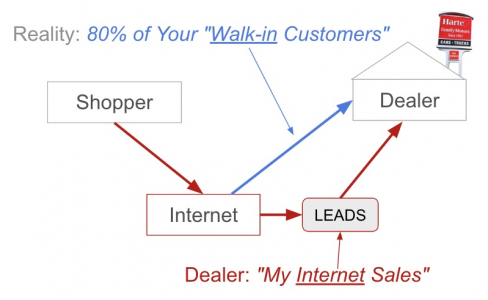
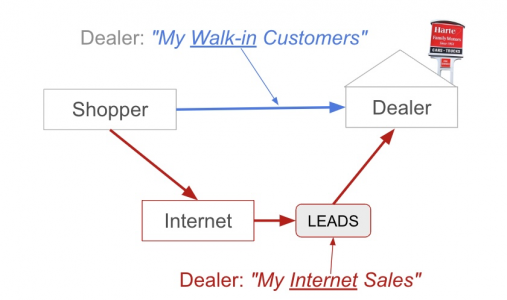
In the internet era, our industry has had little innovation and has lagged other industries. IMO, dealers have not demanded anything but lead gen from digital vendors, and this is why:
1708612497866.png
(above) Back in the day, when the internet was a baby, Dealers saw the internet customer as a sideshow, they created stand alone departments and pay plans for "My Internet Sales".

Inverse Relationship Between CarGurus and Cars.com SRP/VDP Conversions?

I handed this type of classifieds review off to the CMO a couple years ago and it'll most likely come back into my lap later this year. I love this stuff but not in my front view a this point.

Love to know why your CMO thinks the # of saves went way up.

I need a replacement for AccuTrade...Any Suggestions?

I've been looking for an alternative to Stockwave for a while and there doesn't seem to be anything the same functionality. Even though Stockwave is severely broken in many ways and Cox offers ZERO customer support, it's the best I've found. I demoed Accutrade but ultimately decided Stockwave was a better alternative for how we were sourcing inventory.

I feel like there's a pretty large product hole where Accutrade left off. I've been wanting to work on something like this for a while but lack the bandwidth at the moment.
Hi,
I have come across the same issue with Stockwave. I am just curious what other software have you tried in addition to them? If you are looking for a good chrome plug in tool, I just started using Carbly and I am impressed so far considering the cost. Here is my referral link for 14 day free trial below. Their auction sourcing tool sucks, but you can add what you need ala-carte. I think I am paying $150/month for base software plus kbb and mmr data.
  • Like
Reactions: Jon Singo

Inverse Relationship Between CarGurus and Cars.com SRP/VDP Conversions?

After speaking with my account managers at each of "The Big 3," it seems like the biggest problem with comparing the conversion rates is how they measure what exactly constitutes an SRP.
It seemed like they were never wanting an apples to apples comparison by tweaking their versions of data. Cargurus SRPs counted everything that loaded "below the fold" even if the scroll never made it to someone's eyes so they had more SRPs but lower SRP/VDP rates. AutoTrader used to run any metric that had to do with "per vehicle" (like VDP per) using average daily inventory counts as the denominator whereas Cars.com used the total syndicated unique VIN count in that same range. So AutoTrader used to always come to the table with "we provide more VDPs per vehicle". Earlier than that Cars.com and AutoTrader had different SRP CTAs and information shown in the SRP view so shoppers had to click through the SRP into the VDP to get the same information as the competitor driving up conversion and VDP views.

Are they still doing any of this now? I'm somewhat removed from monitoring this in my stores in the last few years in my current role. I do recall spending time with Cargurus VP of Dealer Product, Andrew Grochal, in '20 and at the time and he was very responsive to some changes on the dashboard and reporting. I think I got the 13th month on the dashboard and SRP views to show above the fold during the meetings we had.

Inverse Relationship Between CarGurus and Cars.com SRP/VDP Conversions?

After speaking with my account managers at each of "The Big 3," it seems like the biggest problem with comparing the conversion rates is how they measure what exactly constitutes an SRP.

Dude, you ask great questions, I was head of marketplace at CARS and no one ever asked that question and I never thought of it either ;-)
  • Like
Reactions: BillKVMotorCo

FRIKINtech Service Drive Spending in 2023

As of May 2023, vehicle repair prices had already jumped 23% over 2022. The cost of maintenance is one of the most inflationary things consumers are experiencing. It is just behind healthcare increases.

The increased inflation rate wasn’t the full cause of these vehicle repair and maintenance increases. The average vehicle on the road in 2023 was 12.4 years old. And as these vehicles get older, they get more expensive to keep running.

Before the pandemic, we saw repair orders closing with an average cost of less than $300. In 2023, the average repair order paid was $513. That’s insane!

It is no wonder that nearly half the people who receive an offer to see how much equity they might have in that car they just serviced or check that offer out.

The average car payment tipped $739 for a new car in Q4 of 2023. The average repair order people paid before selling their car to the dealership was $564. Services varied from oil changes to major repairs before people got rid of the car they had just serviced. What happens a lot of the time is people have back-to-back repairs or maintenance, and they begin to lose faith in the car they’re currently driving.

More expensive repairs constituted 8% of total repair orders in 2023. This group typically represented older vehicles because their repair orders were over $1,500. Often, these vehicles are tougher to sell at retail when they are traded or sold to the dealership. These are the ones that go straight to auction, but with the reduced amount of used inventory in the market, these vehicles have done better as retail pieces. The number of cash buyers has also increased, and these kinds of cars have been appealing to those buyers.

Overall, we are seeing a steady increase in service customers interested in what their car is currently worth. It makes total sense as these vehicles are aging and costing these owners more and more.

Inverse Relationship Between CarGurus and Cars.com SRP/VDP Conversions?

Dan, did your group do a big mark down event in the June, July, Aug, Sept 23
For Used, we have a pretty hard stop at 75 days with pricing strategies set at a lower and lower % of market at 15, 30, and 60 days. Bronze units are limited to a hard 45 day. I think we implemented those price rules and day rules in the late spring last year so that was the reason. I handed this type of classifieds review off to the CMO a couple years ago and it'll most likely come back into my lap later this year. I love this stuff but not in my front view a this point.
January saved VINs are off the chart, how was used sales??
All stores hit forecast on Used in January, so it was a good Used month.
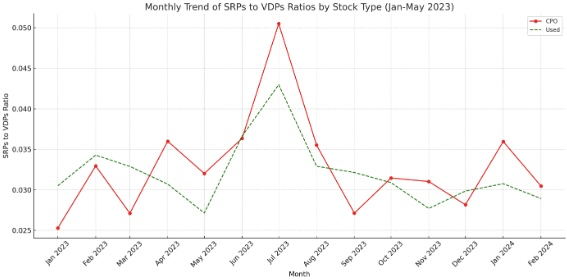
Dan, if you add CPO WIFM on the hero, u may boost CTR and get you some free traffic
That seems to be a common theme of managing Homenet and our banners. Our recon process either misses or Homenet gets crossed. Either way, digital-lot-walk isn't happening like it should from Used managers. We are looking at other options to make sure this is consistent in both system and accountability.
  • Like
Reactions: joe.pistell

Inverse Relationship Between CarGurus and Cars.com SRP/VDP Conversions?

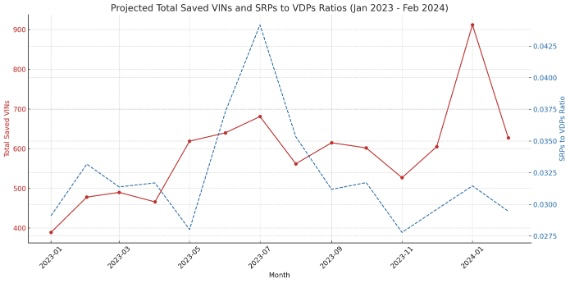
Chart Hypothesis:
If higher CTR = higher shopper interest, is that seen in higher counts of saved vehicles?
1708456983933.png
Fascinating.
My gut was off on this one. They are correlated, I expected a far higher correlation.

@Dan Sayer January saved VINs are off the chart, how was used sales?? (I prorated Feb saves, they look good)
  • Like
Reactions: Dan Sayer

Inverse Relationship Between CarGurus and Cars.com SRP/VDP Conversions?

woa boy, @Dan Sayer here we go...
Assuming SRP traffic is the same, Higher CTR will create more VDPs. For every 100,000 SRPs. a 1% rise in SRP/VDP ratio will create 1,000 more VDPs (FREE :)

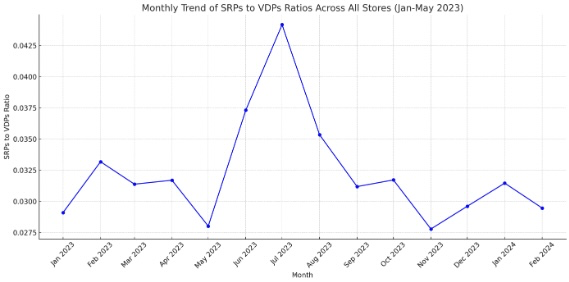
To get a read on how stable SRP/VDP CTR is, I wanted to see it mapped across time, across all stores (Used only)
1708455510617.png
Woa, what a peak in June-Sept 23. Before and after looks to be the 'normal' CTR range. I ck'd to see if any store(s) caused this outlier, all stores generally rose and fell in this period (Anderson Ford South rose the most, Anderson Kia of St Joseph rose the least).

Dan, did your group do a big mark down event in the June, July, Aug, Sept 23?
Thoughts?
  • Like
Reactions: BillKVMotorCo

EVs are coming, but for how long?

When you see any EV conversation on LinkedIn these days, they all sound a lot like this:

  • Like
Reactions: craigh

Filter