

- Nov 4, 2026
- 5
- 0
- Awards
- 1
- First Name
- Ibrahim
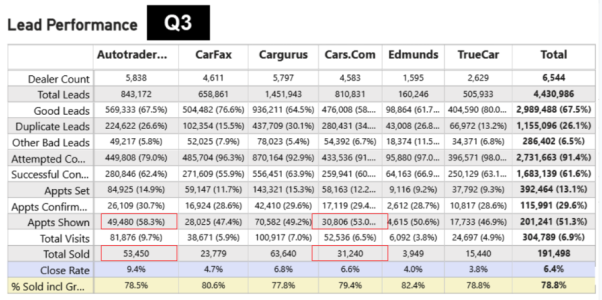
Closing % by source is the right lens, but a lot of buyers never submit a form at all, so every source looks worse than it is.




1. Manual attribution - the rep is giving credit to a source that may not be the actual source.
2. We're counting solds in the month they sold and leads in the month they were submitted. That can skew a close %. A q3 average view should be long enough to compensate for that though.
| Platform | Q3 Close Rate | Cost per Sale |
|---|---|---|
| Autotrader | 9.4% | $532 |
| CarGurus | 6.8% | $735 |
| Cars.com | 6.6% | $758 |
| Carfax | 4.7% | $1,064 |
| Edmunds | 4.0% | $1,250 |
| TrueCar | 3.8% | $1,316 |
| Overall | 6.4% | $781 |
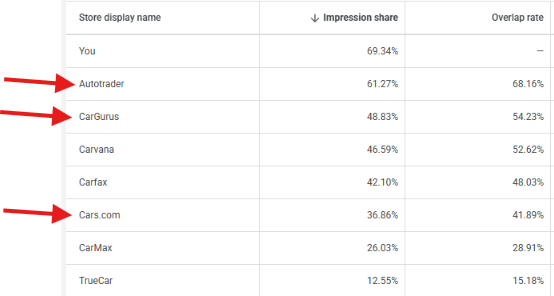
They are using the dollars you give them, and your inventory, against you and driving up YOUR costs.
*** Think about this the next time they come at you with a price increase.
 Drew brings the bombs, and he's almost always right (almost is just for those times I wasn't around and he was wrong).
Dealers debate which third-party lead sources deliver the best ROI, with Q3 close-rate data showing AutoTrader leading at 9.4% and TrueCar trailing at 3.8%. A key insight is that close rate alone is misleading — attribution flaws in CRMs like VinSolutions inflate certain platform numbers, buyers often skip forms entirely, and third-party sites increasingly buy paid traffic using dealers' own inventory to outbid them on Google, effectively raising dealer acquisition costs while justifying their own price increases.