

- Nov 4, 2026
- 5
- 0
- Awards
- 1
- First Name
- Ibrahim
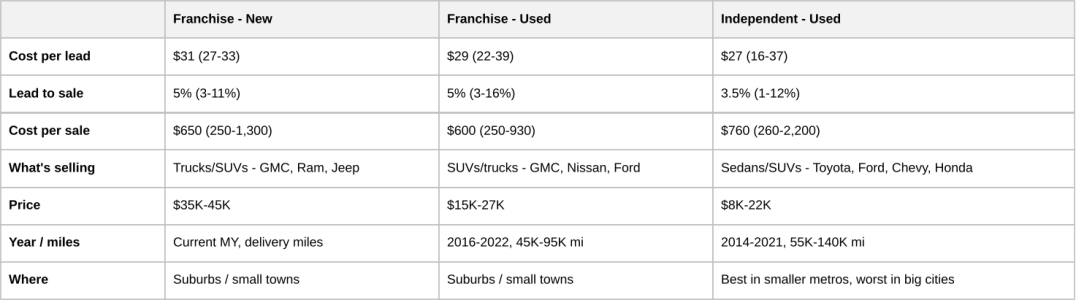
Closing % by source is the right lens, but a lot of buyers never submit a form at all, so every source looks worse than it is.



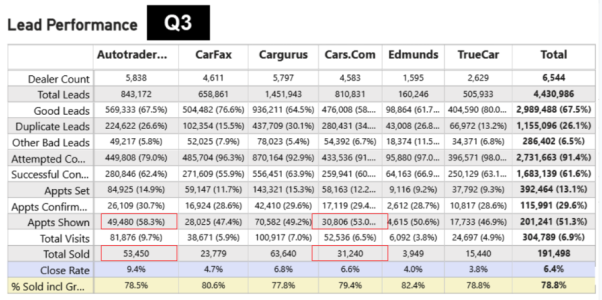

1. Manual attribution - the rep is giving credit to a source that may not be the actual source.
2. We're counting solds in the month they sold and leads in the month they were submitted. That can skew a close %. A q3 average view should be long enough to compensate for that though.
| Platform | Q3 Close Rate | Cost per Sale |
|---|---|---|
| Autotrader | 9.4% | $532 |
| CarGurus | 6.8% | $735 |
| Cars.com | 6.6% | $758 |
| Carfax | 4.7% | $1,064 |
| Edmunds | 4.0% | $1,250 |
| TrueCar | 3.8% | $1,316 |
| Overall | 6.4% | $781 |
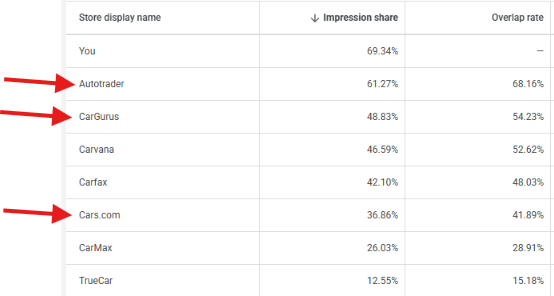
They are using the dollars you give them, and your inventory, against you and driving up YOUR costs.
*** Think about this the next time they come at you with a price increase.
 Drew brings the bombs, and he's almost always right (almost is just for those times I wasn't around and he was wrong).

Dealers are debating which third-party lead sources deliver the best ROI, with shared Q3 close rate data showing AutoTrader leading at 9.4% and TrueCar trailing at 3.8%. The thread quickly moves beyond raw close rates to expose deeper issues: single-source CRM attribution inflates certain platforms' numbers (AutoTrader benefits from alphabetical drop-down ordering), third-party sites increasingly buy paid traffic using dealers' own inventory to outbid them on Google, and multi-touch attribution tools like Clarivoy suggest much of the real value from these platforms is upstream exposure rather than direct leads. The key takeaway is that evaluating third-party providers on lead count or close rate alone is misleading—dealers should measure total cost per sale, gross per copy, and DMS-matched results while accounting for attribution flaws.