• Stop being a LURKER - join our dealer community and get involved. Sign up and start a conversation.

Inverse Relationship Between CarGurus and Cars.com SRP/VDP Conversions?

Dan Sayer

Boss
Staff member
Dec 4, 2009
514
565
Awards
7
First Name
Dan
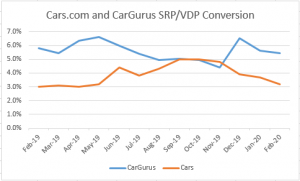
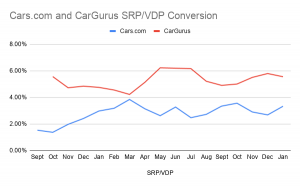
I've been tracking data from our 3rd Party Classifieds for a very long time and one of the (many) items I monitor is the SRP/VDP conversion. I feel this is one of the indicators of how well we are merchandising, pricing, etc our inventory. I've noticed this odd inverse relationship between Cars.com and CarGurus where if Cars.com SRP/VDP conversion raises, CG dips and if Cars.com falls, CG goes up. This is one of our stores in the Lincoln, NE market. The data below is USED Cars.com SRPs/VDPs vs CarGurus total SRP/VDP since they tell me 99% are USED.

Am I missing something? Is anyone else experiencing this? Obviously, these are the same cars with the same merchandising, etc so my theory on what information SRP/VDP conversion indicates about merchandising doesn't fly in this case. Math is total VDPs divided by total SRPs.
Cars.com and CarGurus SRP_VDP Conversion.png
 
I read your post back on wednesday and I have been thinking on it off/on Dan. I replicated the data from your chart (best I could).

First things first, the correlation is -0.33 which doesn't reach the level of significance I would start to create a conspiratorial revolution about ;) let alone go crazy over. That to me is >.60 or <-.60. The reason it is a weakish correlation is because you have to factor the significance of individual months change. The correlation of -0.33 factors this but I tired to represent it for you below in an easier way (since it is baked in).
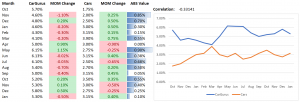
I took the change each month versus the prior month within each site and then took the absolute value of them after adding them together. This effectively shows the individual month variance in change in a relative way. There are only 6 out 15 month that have a relative rate of change greater than 0.5%.

Long story short there is a weak correlation that is part of the randomness of all numbers in a dynamic system like this. Is their a variable that impacts this change, yes I am sure there are dozens that could absolutely be figured out with the underlying data. But we can't surmise that from the chart, honestly I wouldn't worry about it a second more either.

1581465430646.png
 
  • :light:
Reactions: Jeff Kershner
Correlation?

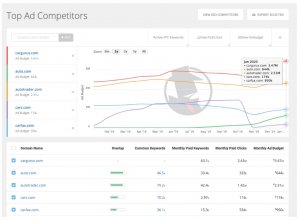
An argument could be made that as they increase paid media the customer that arrive are less likely to do engage in individual vehicles. As paid media is typically of lower quality than organic. But my quick eye test of this chart says otherwize, Also, SEMRush is not accurate as it is not true ad spend, it is sampled. You also have to factor TV ads, which drive awareness and feed top funnel, who will be less engaged than paid media who are mostly model specific.

Again, this is also a super super small sample size of dealerships with other dynamics in play like how certain vehicles you have in stock over a period of time will outperform on one site versus the other based on the demographics of cars vs cargurus shoppers in an individual market. This rabbit hole isn't worth guys - but fun to think about.
 
I read your post back on wednesday and I have been thinking on it off/on Dan. I replicated the data from your chart (best I could).

First things first, the correlation is -0.33 which doesn't reach the level of significance I would start to create a conspiratorial revolution about ;) let alone go crazy over. That to me is >.60 or <-.60. The reason it is a weakish correlation is because you have to factor the significance of individual months change. The correlation of -0.33 factors this but I tired to represent it for you below in an easier way (since it is baked in).

I took the change each month versus the prior month within each site and then took the absolute value of them after adding them together. This effectively shows the individual month variance in change in a relative way. There are only 6 out 15 month that have a relative rate of change greater than 0.5%.

Long story short there is a weak correlation that is part of the randomness of all numbers in a dynamic system like this. Is their a variable that impacts this change, yes I am sure there are dozens that could absolutely be figured out with the underlying data. But we can't surmise that from the chart, honestly I wouldn't worry about it a second more either.

View attachment 4581

@Jon Berna YOU SO SMART!!
 
An argument could be made that as they increase paid media the customer that arrive are less likely to do engage in individual vehicles. As paid media is typically of lower quality than organic. But my quick eye test of this chart says otherwize, Also, SEMRush is not accurate as it is not true ad spend, it is sampled.


Not arguing but FYI - this isn't from SEO RUSH. But may be comparable - https://www.spyfu.com/semrush-alternative
 
Haha, at first I was like this is too complicated to think about #otherpriorities #attribution...hehe

Then I was like yeah but what's the actual correlation. If it was high aka negative correlation <-.60 it would be worth more of an inspection as we have a ton of this data.

Dan I give you credit for posing the question it's definitely a unique thought experiment. The secondary part is what do I do with this information. To me that is where this effort is mute. What these two companies do to drive traffic and move customers through the shopping process mater, however are they linked in a way that would create a mirror effect? Even if we knew what governs that it I dont think it's something that helps me find new value.
 
  • Like
Reactions: Jeff Kershner